Daily insights for city builders, delivered every morning at 6 AM ET. I’m Brandon Donnelly — a Toronto-based real estate developer and founder of Globizen. I’ve been writing here since 2013.

Tag: development

  • How’s your PTAL these days?

    image

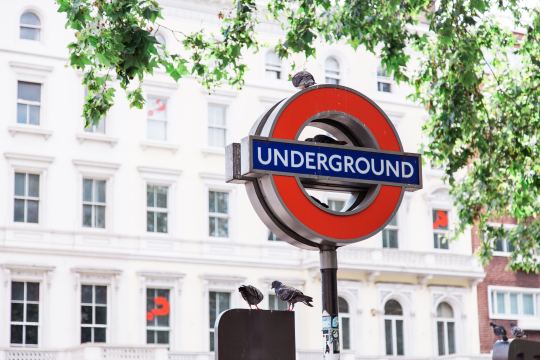
    As I was going through the new London Plan yesterday I noticed a number of references to PTAL. I didn’t know what this was, so I obviously had to look it up.

    It stands for Public Transit Accessibility Level. It’s a methodology that was developed in London in the 90′s. And it’s a measure of access to public transit, or of the density of the public transport network at any given location.

    There are 6 levels, though two of the levels are further subdivided into 2 sub-levels for greater precision:

    • 1a and 1b
    • 2
    • 3
    • 4
    • 5
    • 6a and 6b

    1 is bad. 6 is good. 

    What’s captured in this measure are the walking times from a particular location to the nearest transit access points; the reliability of the available services; the number of services available; and the average wait times.

    Historically, this measure has helped to determine how much density could be built on a particular site, how much parking should be provided, and so on. 

    For example, in the new London Plan, PTAL 5 and 6, as well as Inner London PTAL 4, are expected to see development with no residential parking. Once you move to PTAL 3, the parking maximum moves up to 0.25 spaces per unit. 

    In the draft London Plan you’re also supposed to use the highest existing or planned PTAL. So if transit improvements are planned for the area, you factor those into the calculation.

    Seems quite rationale (though it’s probably not a perfect measure of access and connectivity).

    If you’d like to determine the PTAL for a particular address in Greater London, you can do that here. Unfortunately, I don’t have a calculator for you if you happen to live outside of London. But there is one simple check you can do.

    The PTAL methodology assumes an average walking speed of 4.8 kph. The maximum allowable walk time for buses is 8 minutes and the maximum walk time for subway and light rail is 12 minutes. These numbers translate into distances of 640m and 960m, respectively.

    How far do you have to walk to access good transit?

    Photo by Bruno Martins on Unsplash
  • New London Plan released today

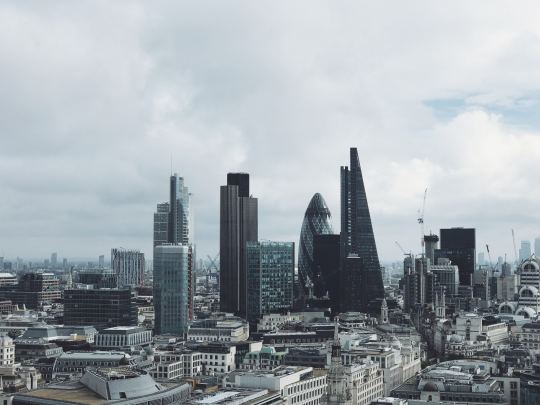
    A draft version of the new London Plan was released today for public consultation. It is “the spatial development strategy for Greater London”. And you can download all 524 pages of it, here. A final copy of the Plan is expected to be published by fall 2019.

    Here is what mayor Sadiq Khan had to say about the Plan (quote from The Guardian):

    “I am using all of the powers at my disposal to tackle the housing crisis head on, removing ineffective constraints on homebuilders so we make the most of precious land in our capital.”

    And that tone comes through in the document. Here is an excerpt from the “optimising housing density” policy section:

    “For London to accommodate growth in an inclusive and responsible way every new development needs to make the most efficient use of land. This will mean developing at densities above those of the surrounding area on most sites. The design of the development must optimise housing density.” (Section 3.6.1)

    The Plan also contains a set of clear performance indicators. They cover things like the supply of new homes, the supply of affordable homes, modal share in the capital, and so on.

    The ambition is 66,000 net additional homes each year. And by 2041, the goal is that 80% of all trips in London will be by foot, cycle, or public transport. There simply isn’t road the capacity.

    Which is why the plan also specifies parking maximums, as opposed to parking minimums. The Plan wants the starting point for any development that is well-connected to transit – or to future transit – to be “car-free”.

    If you have a chance, the new London Plan is worth a scan. Maybe you don’t want to print it though.

    Photo by Rob Bye on Unsplash

  • An even longer view on home prices — this time in Amsterdam

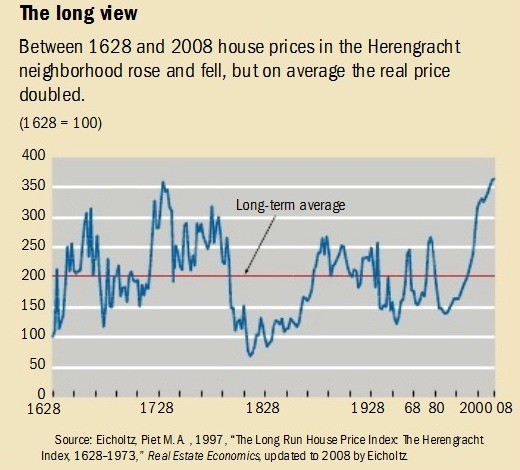
    In the comments of my recent post about Manhattan real estate prices during the Great Depression, a regular reader of this blog shared this terrific blog post (and corresponding research paper by Piet Eichholtz) about house prices along the Herengracht canal in Amsterdam from 1628 to 1973. Later it was updated to include up to 2008. It’s a long run house price index.

    Probably the first thing you’ll notice is that the index is highly volatile. Amsterdam enters its Golden Age, creates the world’s first stock exchange, and becomes the wealthiest city in the western world – house prices go way up. The tulip mania bubble pops – house prices go way down. It’s not until after World War II that prices sort of start to stabilize and increase, maybe, more consistently.

    In nominal dollars, the house price index increases 10x over the study period. But in real dollars most of that disappears. The biennial increase (that’s how the study was done) over the same period of time is just 0.5%. That translates into a doubling of house prices, which may seem quite good, except that remember it’s over a 380 year time period.

    image

    The Herengracht canal is a particularly good study because it was and has remained (or so I’m told) a desirable part of Amsterdam. This is an attempt to control for the variable that maybe some of the volatility could be explained by the area simply falling out of favor. (As a quick sidebar, the Herengracht was one of the first canals laid and dug out around the original city center of medieval Amsterdam during its Golden Age.)

    Generally, this finding is in line with one that economist Robert J. Shiller famously published a number of years ago where he argued that, when you correct for inflation, home prices actually look remarkably stable over long-run forecasts. In one study, he looked at 100 years of US home prices ending in 1990. Real home prices increased about 0.2% a year. What an outstanding hedge against inflation.

  • End of the automotive era

    Bob Lutz is a former vice chairman and head of product development at General Motors. Recently, he had this to say about the future of the auto industry. 

    Here are a couple of powerful snippets:

    It saddens me to say it, but we are approaching the end of the automotive era.

    The auto industry is on an accelerating change curve. For hundreds of years, the horse was the prime mover of humans and for the past 120 years it has been the automobile.

    Now we are approaching the end of the line for the automobile because travel will be in standardized modules.

    Everyone will have five years to get their car off the road or sell it for scrap or trade it on a module.

    Bob is 85 years old. This is somebody who spent his entire life in the auto industry telling us that the old model is now done. 

    It reinforces something that I wrote about here, where the “end of the automotive era” was pegged at around 2021. 

    And it is part of the mental model that I have started relying on today for decision making.

    Photo by Alessio Lin on Unsplash

  • The Toronto and Vancouver housing markets

    CIBC World Markets recently published this report by Benjamin Tal talking about the Toronto and Vancouver housing markets. Here is an excerpt:

    “But when the fog
    clears it will become evident that the
    long-term trajectory of the market will
    show even tighter conditions. The supply
    issues facing centres such as Toronto and
    Vancouver will worsen and demand is
    routinely understated. Short of a significant
    change in housing policies and preferences,
    there is nothing in the pipeline to alleviate
    the pressure.”

    It’s a good read. Worth your time.

    One stat that stood out and directly relates to some of the topics that we frequently talk about on this blog is the shift in Toronto from low-rise to high-rise housing.

    In the report there’s a chart showing the “change in [housing unit] completions” in 2016 as compared to 2000. The switch from low-rise to high-rise is almost 1:1 in Toronto. In other words, we substituted high-rise housing for low-rise housing. 

    I think this speaks volumes about the fundamentals underpinning the Toronto condo/apartment market. We are continuing to build up because it is the future of housing in this city.

  • Case study: 9-unit infill rental development in DC

    This is an interesting ULI case study about a 9-unit infill rental development in Washington, DC called Oslo (click here if you can’t see the video below):

    [youtube https://www.youtube.com/watch?v=G8FfT6UREuc?rel=0&w=560&h=315]

    The units are a mix of 3-bedroom and 4-bedroom apartments. The target market is recent graduates and millennials who might otherwise be sharing (”group living”) in a townhouse or single-family home to save on rent.

    Another notable aspect of this project is the fact that the previous building was a legal non-conforming 9-unit apartment building. In other words, the current zoning wouldn’t allow it today. So to preserve their zoning status, they had to figure out a clever workaround during construction.

    A project exactly like this – where you’re replacing an existing apartment building – probably wouldn’t be possible in Toronto because of our rental housing demolition and conversion bylaw. 

    But I wanted to share it because I am sure that many of you, including those outside of this city, will appreciate it as a good example of low-rise infill development.

  • Constructing the tallest building in San Francisco

    Alexis C. Madrigal recently published a piece about the Salesforce Tower in San Francisco called: The Tower at the Heart of the Tech Boom. At 61 floors and 1,070 feet, it is now the tallest building in San Francisco and the second tallest building west of the Mississippi River after the Wilshire Grand Center in Los Angeles.

    Hines and Boston Properties are the developers of the building. Pelli Clarke Pelli is the architect. And Salesforce is the anchor tenant. In April 2014, it was announced that they had leased 714,000 sf on floors 1, 3-30, and 61. (Get that top floor.) So almost half of the building.

    Perhaps not surprisingly, Madrigal calls the Salesforce Tower the “the most visible monument to the industry [tech] in the region and the country.” It is a demonstration of the power and reach of Silicon Valley. San Francisco has a new symbol. The TransAmerica Pyramid now feels inadequate.

    Though interesting, this is actually not what I want to talk about today. I’d like to talk about what it took to build such a tall building in a seismically active city like San Francisco. Unfortunately, this feels timely given that the sinking Millennium Tower is getting so much attention right now.

    The structural engineer for the Salesforce tower is Seattle-based Magnusson Klemencic Associates (MKA). They are a world-renowned structural and civil engineering firm that have been around since the 1920s. Other projects they are currently working on include the third tallest building in Chicago.

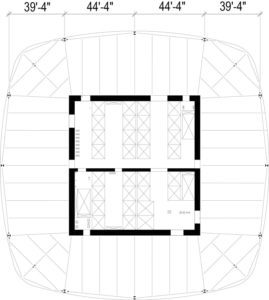
    The tower’s seismic force-resisting system is made up of reinforced concrete shear walls that surround the central elevator and exit stair core. These walls are 24 to 48 inches thick. Here is a plan taken from a STRUCTURE Magazine post written by Ron Klemencic of MKA:

    image

    The tower’s foundations have been well documented, or at least frequently mentioned, because of how deep they had to go down. The site has poor soil conditions (fill, sand, San Francisco “old bay clay”, and weak bedrock), and so given the weight of the tower the only option was to go down to bedrock – approximately 250 feet below grade.

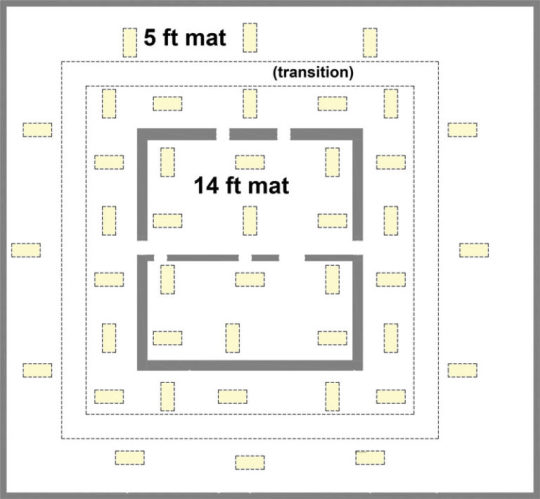
    The foundation system they ended up going with uses something called Load-Bearing Elements (LBEs). The typical LBE measures 5′ x 10.5′. The entire foundation system uses 42 LBEs and a mat foundation that varies in thickness from 14′ around the core to 5′ around the perimeter. (See image below.) The LBEs were brought down to rock. And in some cases, they went down more than 310 feet below grade.

    image

    As a condition of buying the site, the Transbay Joint Powers Authority required proof that any future tall building would not negatively impact the surrounding structures – including the adjacent Transbay Transit Center – and that it would perform under a Maximum Considered Earthquake (MCE) event.

    So while the tower itself may be a symbol for the new world, its structural system also achieves many firsts in terms of how to build a supertall in a seismically active region.

    Please keep in mind that I am not a structural engineer. I just pretend to be an architect sometimes. If you’re interested in more of the details, check out the post by Ron Klemencic. All of the above information was taken from there.

  • Planning dinner, smart cities, and privacy

    image

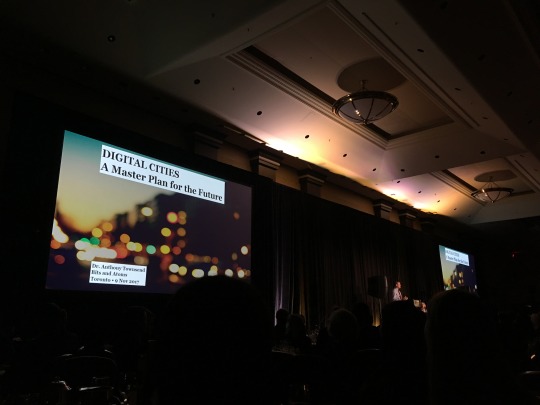
    This evening I attended the 27th Annual Toronto Planning Dinner. It’s an annual dinner for people in planning and development, put on by the University of Waterloo Planning Alumni of Toronto. Thank you Wood Bull LLP for the invite.

    The keynote speaker was Dr. Anthony Townsend. He is the author of SMART CITIES: Big Data, Civic Hackers, and the Quest for a New Utopia. I haven’t read it (yet), but his talk offered a preview of it and I think it would be of interest to all of you.

    It deals with many of the topics that we discuss on this blog, one of which is the interrelationship between our physical environment and the networks and software layers that we are now building on top of it.

    These layers have the potential to augment and enhance our cities (maybe make them smarter), but they also have the potential to do us harm. One important issue that Townsend brought up is that of privacy.

    Cities used to enable anonymity. 

    When essayist and art critic Charles Baudelaire wrote about “modernity” in 19th century industrializing Paris, it referred to an ephemeral and fleeting kind of urban environment. Pass someone on the street and you may never see them again. That must have felt sad at the time.

    Today we live in a fish bowl. 

    Networks connect us, check us in, ping us when we are nearby people we know, and help us find people to meet and date. And we already have devices, like Alexa, that spy on us in our homes so that companies can serve us targeted ads. (This is deplorable by the way.)

    Will the city of the future endeavour to do the same as we equip it with more “smarts”?

    I guess that’s why Townsend believes that privacy will define a big part of 21st century urbanism. There’s no doubt that it will be very important.

  • Toward more family condos

    The Ryerson City Building Institute and Urbanation recently published a terrific report called: Bedrooms in the Sky. Is Toronto Building the Right Condo Supply? 

    Here is a quick synopsis: The 35-44 year old age bracket in this city will see significant growth over the next decade; single family homes are really expensive; and we’re not building enough family-friendly condo units.

    When Urbanation looked at the data for all condo units currently under construction they found that the unit mixes still skewed toward 1-bedroom units, but that the number of 3-bedroom units is starting to trend upward. That feels right.

    The report also talks about the affordability gap between condos and houses. The average condo in the Greater Toronto Area costs about $511,000, while the average detached house costs $1,134,000.

    However, this isn’t exactly an accurate comparison because the average condo is smaller in size than the average house. I think a better metric is to look at price per square foot.

    Also, houses give you the flexibility of a secondary suite. Right now that usually means a basement apartment, but pretty soon it’ll likely include a laneway suite. That creates an additional income stream and helps with overall affordability.

    In any event, up until maybe recently, houses generally looked cheaper on a per square foot basis. And my view – which I have written about extensively on this blog – was that as soon as houses become “more expensive”, we’ll see an uptick in larger family-oriented condos.

    A few weeks ago I went to an open house in a desirable area of Toronto. It was for a 1,300 sf semi-detached house with good bones, but in need of a full gut. Basement was low, only suitable for humans around 5′ tall. It sold for $1 million.

    Let’s say that house needs $300,000 to bring it up to the level of a new condo. If that doesn’t include some sort of extension, now you’re in for $1.3 million or about $1,000 per square foot. You can still find a condo for less than that.

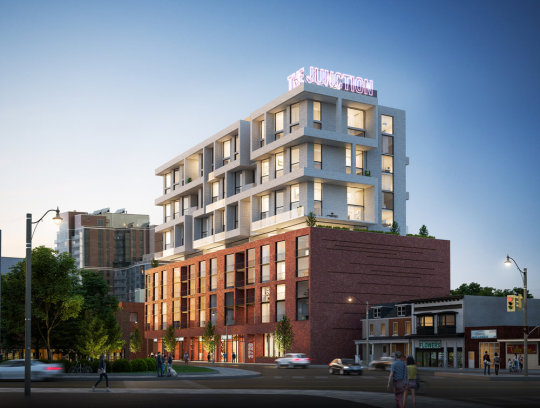
    Which is one of the reasons why I think we’re now starting to see an uptick in larger/family units. (We are trying to do it at Junction House.) 

    But like all things in real estate, these things move slowly. The condos under construction today were designed years ago. Changes take time to work themselves through the system.

  • Junction House Community Meeting

    image

    Okay, last Toronto-centric post for the week. We are back to regular scheduled programming tomorrow.

    Later this month, Councillor Gord Perks will be hosting a community meeting for Junction House (see conceptual rendering above).

    You can find all of the details, here, on the Globizen blog. But pop it into your calendars: Tuesday, November 21, 2017 from 7 to 9pm.

    Even if you can’t attend, definitely weigh in on the rooftop public art component over in the comments on the Globizen blog.

    I hope to see you all there. It’s always nice when happy people come out.