
Daily insights for city builders, delivered every morning at 6 AM ET. I’m Brandon Donnelly — a Toronto-based real estate developer and founder of Globizen. I’ve been writing here since 2013.

Tag: detroit

  • Detroit is back!

    Fascinatingly, buildings are always a product of their time.

    Detroit’s Book Tower, for example, started construction in 1916. This is right around the time that Detroit became the 4th largest city in the US (after New York, Chicago, and Philadelphia). From 1910 to 1920, the city’s population grew by about 113% to nearly a million people (more people than the city has today).

    Because this was the time, the tower was obviously grand. It totalled almost half a million square feet of office space (483,973 sf to be exact, according to Wikipedia). It had a large 3-story atrium with an ornate glass dome. And up until the 1970s, it seems that it remained a desirable office address on Washington Boulevard.

    But as we all know, things changed for Detroit. Grand and ornate no longe made economic sense. And so the owners at the time, whoever they were, covered up the ornate dome, filled in the floors of the atrium, and presumably did whatever they could to eek out as much leasable square footage as possible. Necessity trumped grandeur.

    Then in 2007, the then-landlord filed for Chapter 11 protection. And in 2009, the last tenant left the building, leaving it 100% vacant — or “unencumbered by tenants” as we like to say in the business.

    Thankfully in 2015, Dan Gilbert of Bedrock came along to do what he does, and acquired the building for a reported $30 million. This works out to about $61 psf for what was once the tallest building in Detroit and one of its most prestigious office addresses. Things change.
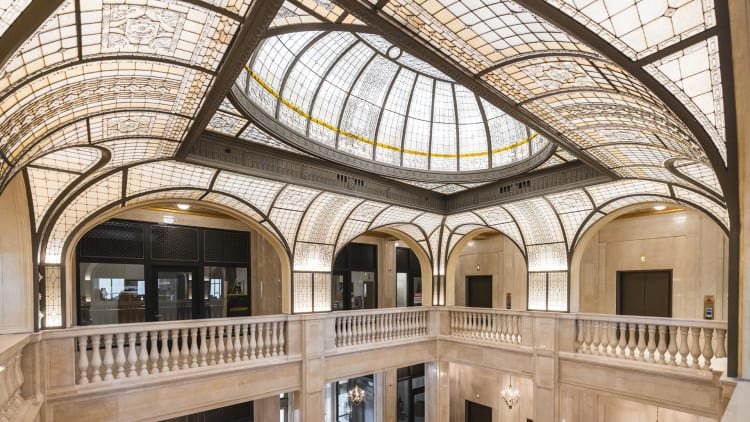
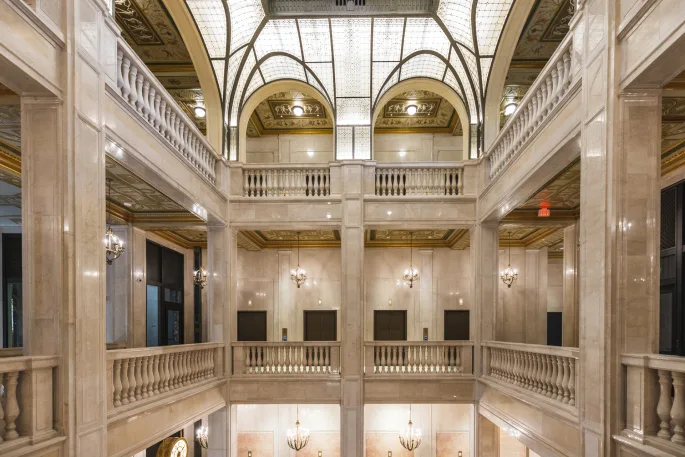
    But what Bedrock has done since is work to return the building to what architect Louis Kamper had originally created nearly a century ago. The atrium is back. The ornate glass dome is back. And there are now 229 apartments, 117 extended-stay hotel rooms, 3 food and beverage concepts, and about 40,000 sf of office space. Official website, here.

    What an awesome way to say, “Detroit is back!”

    Photos: Rebekah Witt via Fast Company

  • Grit and resilience in Detroit

    Earlier this month, the new Hudson’s tower in Detroit “topped out.” Meaning, they laid the last steel beam at the top of building. This, to me, is fantastic news. (Here’s the official project website in case you’re interested.)

    The tower, which was designed by New York-based SHoP Architects, is just over 685 feet tall. This makes it the second tallest building in the state of Michigan, after the Renaissance Center. And when it’s complete, it will house 1.5 million square feet of office, retail, food, residential, hotel, and event space.

    This week it was also announced that General Motors will be moving its headquarters and its 5,000 downtown employees to this new tower. I don’t know who will backfill their old space in the Renaissance Center, but that’s a topic for a different day. Today, I think we should be talking about the grit and resilience of Detroit.

    This is a city that reached a peak population of approximately 1.85 million people in 1950, had its population decline by more than 65%, and then became the largest city in the US to declare bankruptcy (2013). Now they’re building a big ass mixed-use tower in the center of downtown.

    👊

  • Detroit’s cultural alley

    Art and culture are powerful tools for city building. Pictured here is a laneway in downtown Detroit that is known as “The Belt.” It is called this because of its location in the city’s former garment district, but today, it has been redefined as a cultural alley. In it, and deep within unmarked basements, you’ll find venues like Deluxx Fluxx, which call themselves a nightclub art house. (You’re going to want to click through to their website and get a feel for the place.)

    This alley isn’t brand new. It was conceptualized by the art gallery Library Street Collective a few years after it was founded in 2012. But I think it remains an excellent example of at least two things. One, Detroit is cool. It really has been going through a cultural renaissance. (You should also know that Detroit is the birthplace of techno.) And two, The Belt remains a perfect example of what is possible with our underutilized urban spaces.

    Virtually every city has alleys exactly like this one. But too few are doing something as cool with them.

    Image: The Belt & Deluxx Fluxx

  • America’s most affluent cities

    This is an interesting chart from Bloomberg showing the most affluent metropolitan areas in the US in 1949. As you can see, at the top of this list is Detroit, followed by mostly older industrial centers.

    Now here’s the list today:

    It’s largely a different list; but importantly, it’s not an entirely new list. San Francisco was a wealthy city in 1949 and it remains one of the wealthiest today. But could that be changing? Given the city’s current challenges, some are questioning whether it might end up as another Detroit.

    I don’t see that happening. And for what it’s worth, here’s evidence of nearly 75 years of resiliency.

    Images: Bloomberg


  • The car versus transit job access multiple

    I haven’t seen this sort of data before and it’s an interesting way of looking at job access, transit connectivity, and overall built form:

    The above is a table from New Geography (using data from the University of Minnesota). And what it shows is how many more jobs, across the US, can be accessed within a 30-minute commute by car versus by transit. For example, what this data tells us is that, on average across the US, there are about 56x more jobs that can be quickly accessed by car versus by transit.

    But there is also huge variation across the 50 largest cities in the US. On the top end is Detroit, where there about 130x more jobs that can be accessed by car (again within 30 minutes). This isn’t at all surprising. Also not surprising is the fact that New York is on the lowest end with only 5.6x as many car-versus-transit jobs. This is one of the reasons why I spoke yesterday about NYC being such an ideal candidate for something like NYC 25×25.

    What a lower number tells us is that the city is far less reliant on personal vehicles and almost certainly has a higher urban density. That’s why you see cities like New York, San Francisco, Boston, and Chicago near the top of this list. And in my opinion, this is where you want to be. The goal should be to minimize this multiple.

    I haven’t seen a dataset like this before, but I’m now curious to see how it varies globally. It feels like something that more of us should be monitoring. Because we know that there are strong links between jobs access and the overall economic performance of a city.

  • Largest US cities grew faster and became more diverse over the last decade

    The last decade has been pretty good for many cities. Recent 2020 Census data tells us that of the 50 largest cities in the US, 46 of them grew their population over the last 10 years. On average, these 50 cities grew by about 8.5%, compared to 5.6% for the decade between 2000-2010.

    As you might expect, the fastest growing cities tended to be in the south and the west. The top 3 fastest growing cities over the last decade were Fort Worth (24%), Austin (21.7%), and Seattle (21.1%). The cities with the biggest population declines were Detroit (-10.5%), Baltimore (-5.7%), Milwaukee (-3%).

    It’s important to keep in mind that city boundaries can skew these numbers depending on how they are drawn. A declining “city” population doesn’t necessarily mean that the broader urban area is losing people. Though it does still tell you something about the “city.”

    Another thing that happened over the last decade is that most of the largest US cities continued to become more diverse. In 2000, white populations were a majority (>50%) in 25 of the 50 largest cities. This dropped to 17 cities in 2010 and then 14 cities last year (2020). Meaning that 36 of the largest cities are now “white minority” cities.

    For more data check out this recent article from Brookings.

  • The birth of electronic music

    What We Started is an interesting documentary about the birth and history of electronic dance music (EDM), starting with house music in Chicago and techno music in Detroit.

    Personally, I view EDM as being distinct from house & techno, and it’s generally not my favorite kind of electronic music. But that’s besides the point. EDM is now wildly popular. It has crossed over into the mainstream and bled into many other genres.

    What’s fascinating about the story of electronic music is that it’s a reminder that new ideas and new movements tend to start out on the fringe. Electronic music came from hobbyists experimenting in their garages, basements, and in warehouses. It was people tinkering with something that they were passionate about.

    And let’s face it, that’s the only way this genre of music could have gotten started because no record label would have signed an electronic DJ back in the 1980s. It was weird and underground, and in the early years, the US mainstream media was openly hostile toward it.

    It reminds me of a blog post that Chris Dixon wrote back in 2013 called, “what the smartest people do on the weekend is what everyone else will do during the week in ten years.” New ideas start on the margin.

    The other fascinating thing about this story is that the emergence of new ideas are often tied to a particular time and place. Think tech and Silicon Valley. In the case of techno, which is often described as being sharper, faster, and more precise than house music, it feels right that it originated in a city like Detroit.

    Detroit was extremely musical, but it was also high-tech. It was machines and assembly lines and that clearly created fertile ground for a new genre of music that relied on, well, machines.

  • What drives attachment to cities

    The Knight Foundation recently published a report looking at what attaches people to the place in which they live. To get this information, they surveyed over 11,000 Americans, some of which live in urbanized areas and some of which just live in metro areas across the United States. This is interesting information to know at any time point in time, but you could argue that it’s even more important at a time like this, where everyone seems to be questioning everything about cities.

    Here are two of their key findings:

    • People who spend more time in the principal or main city of a metro area — whether as residents or as frequent visitors — tend to be more attached. This is is true both in terms of how they feel, but also in terms of how they act, such as how much they give back to the community. I suppose you could debate whether going to the city creates attachment or whether attached people tend to go to the city, but this association does seem somewhat intuitive to me. I am imagining a greater sense of place in principal cities.
    • People who choose to live in a place because of its quality of life tend to express more attachment than people who live in a place for other reasons — such as for work. About 40% of Miami transplants cited the climate as the primary factor for moving. Sounds right. Weather is pretty hard to control, but there are lots of other things that cities can do to improve quality of life. And it seems to be one of the stickier factors. Similarly, access to cultural activities and recreational amenities seem to lead to greater attachment.

    More specifically, here are how some people feel about their metro areas:

    This chart is showing the “perceived accessibility to quality features.” The left column is what they believe to be the national average. And the other columns are for Akron, Charlotte, Detroit, Macon, Miami, Philadelphia, San Jose, and St. Paul. Looking at one row in particular — affordable housing — we see that about 50% of Americans surveyed believe they have access to it. In comparison, only 29% and 12% of residents in Miami and San Jose, respectively, feel the same way.

    For a full copy of the report, click here.

    Chart: Knight Foundation

  • Gentrification in New York, San Francisco, and Chicago is not as it would seem

    Matthew L. Schuerman has a new book out called, Newcomers: Gentrification and Its Discontents. I haven’t read it. But in it, he argues that “gentrification is all around us.” Hence the title. Will Stancil has an interesting rebuttal to this position as part of his book review in the Washington Monthly. Here’s an excerpt:

    Schuerman settles on what he admits is a simple definition of gentrification: the process by which a neighborhood goes from having below-average to above-average incomes for its region. But he never really applies it. While he frequently asserts or implies that gentrification is exploding across cities, he doesn’t say how many neighborhoods actually meet his definition.

    As a demographic researcher, I decided to check. Using U.S. Census data, I looked at the share of people in New York, San Francisco, and Chicago living in places that met Schuerman’s definition of having gentrified between 2000 and 2016. In New York, it’s 3.1 percent of residents. In San Francisco, the number is 4.4 percent. In Chicago, it’s 4.8 percent. Needless to say, this does not represent a vast swath. Although the numbers might increase if the time frame were extended, change at a generational pace is far less disruptive than change that takes place over a few years. Using Newcomers’ own definition, the story of urban America is not a tidal wave of gentrification but creeping racial and economic transition.

    In fact, this aligns with the growing academic consensus that gentrification is much rarer than is commonly believed. This year alone, there have been no fewer than three national studies into the prevalence and location of gentrifying neighborhoods. (Disclosure: I authored one of these studies, for the University of Minnesota.) Despite using very different methods, all three studies roughly appear to agree that about 10 percent of neighborhoods in metro areas were gentrifying. Research has also tended to show that no matter how you measure gentrification in the urban core, it’s almost always more common to find neighborhoods afflicted by intensifying poverty. Out of the fifty biggest American regions, forty-four have core cities where the population in poverty has grown faster than the overall population since 2000. The only exceptions are New York City, Los Angeles, D.C., New Orleans, Atlanta, and Providence.

    This issue of concentrated poverty has come up before on the blog through posts like this one about Detroit. The data is pretty clear: The number of high poverty Census tracts in the US is increasing faster than the number of gentrifying Census tracts (i.e. Census tracts that are becoming wealthier).

    So could it be that the problem isn’t actually gentrification? It is that, paradoxically, gentrification isn’t happening enough and more broadly, and that it is leading to rising inequality across our cities. That strikes me as being the greater issue.

    Photo by Hardik Pandya on Unsplash

  • US cities with the highest millennial homeownership rates

    Across the 50 largest metro areas in the US, about 31.9% of millennials — those aged 18 to 34 — owned a home as of 2017. And according to recent census data (via the Redfin), only 5 of these cities had a millennial homeownership rate higher than 35%. They are as follows:

    The top spot goes to Salt Lake City, which sits at just over 40%. It also has the highest share of businesses owned by millennials at 8.4%. Not surprisingly, the cities on this list all have relatively affordable home prices, with Detroit being the most affordable.

    I think you could interpret this list as a bit of a leading indicator for US cities on the rise. Affordability, and walkability, may be the draws today, but as millennials lay down roots, start businesses and earn more money, I am sure we’ll see these cities transform even further.