Daily insights for city builders, delivered every morning at 6 AM ET. I’m Brandon Donnelly — a Toronto-based real estate developer and founder of Globizen. I’ve been writing here since 2013.

Tag: density

  • Barcelona from above

    Barcelona is one of the densest cities in Europe. And Márton Mogyorósy’s recent photo series, called Barcelona from above, does an excellent job of demonstrating that. My favorite photo is this one here, showing La Barceloneta neighborhood adjacent to the beach:

    None of the buildings are particularly tall (maybe 6 or 7 storeys at the most), but the streets are probably only about 6m wide, including sidewalks. This is one way that you can achieve density without height and it is a good example of what I was getting at in my post, European-style height, but not density.

  • European-style height, but not density

    As I wrote about last month in this pithy post, the relationship between building height and density are often misunderstood. They mean different things and so the implications for our cities can also be vastly different.

    I woke up this morning to a couple of tweets by John Michael McGrath that I think hit the nail on the end with respect to this duality. If you can’t see them below, click here.

    https://twitter.com/jm_mcgrath/status/1105500872979742720

    Paris is known, and largely celebrated, for its “European-scaled” mid-rise buildings. But as John points out, these buildings often line narrow streets (see above). They are typically also built across large blocks with compact internal courtyards and with few setbacks and/or stepbacks. The combined result is that Paris is one of the densest cities in Europe. It has mid-rise at scale.

    The North American context is quite different. The large majority of our land is usually reserved for low density housing. (Here in Toronto this land has been nicknamed the “Yellowbelt.”) We have a policy context that only allows intensification in select places, and that can create pressures to build up. It’s a bit like squeezing a closed tube of toothpaste.

    In 2012, Eurostat ranked Paris as the densest city in Europe with an average population density of approximately 21,516 people per square kilometer. Whereas, according to Wikipedia, the population density of metro Toronto was around 5,905 people per square kilometer in 2016.

    What is it, again, that we love so much about Paris?

  • Height vs. density

    This Planetizen article (2014) by Brent Toderian surfaced over the weekend. It is about tall buildings and why we should be focused more on how they are designed, as opposed to just how tall they are. Brent talks about this in terms of “density done well.”

    One of the things that is often misunderstood when it comes to tall buildings is the relationship between height and density. It is often assumed that the two are perfectly correlated; but they’re not, which is why I like this quote from the above article:

    “Height and density have a relationship, one that can be over-simplified or mischaracterized, but they aren’t the same thing – you can have density without height, and yes, you can have height without density.” -Brent Toderian

    Part of the challenge is that density is a more nuanced metric. Height, on the other hand, is a lot easier to understand. How tall is this building? Oh, it is x storeys tall. But that’s only one piece of the puzzle.

    Photo by Erwan Hesry on Unsplash

  • The disappearing urban advantage

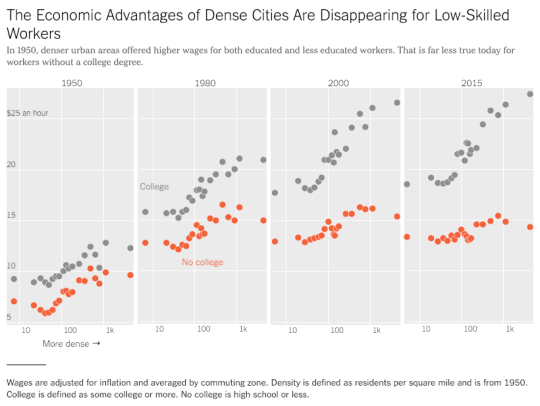
    The New York Times has a recent article up talking about the disappearing “urban advantage” for low-skilled workers. It is based on the work of MIT economist David Autor.

    Here is a chart from the article plotting wages against population density from 1950 to 2015:

    image

    The clear takeaway is that dense urban centers remain a place where wealth is created – but you probably need a college degree.

    The economic advantages of dense cities for those without one appears to be disappearing. The labor market has diverged.

    Interestingly enough, David’s research also suggests that college graduates may be starting to abstain from the suburbs – even when they have kids.

    And that’s because the returns to being in the city are so great.

    For the full NY Times article, click here

  • Invisible walls

    image

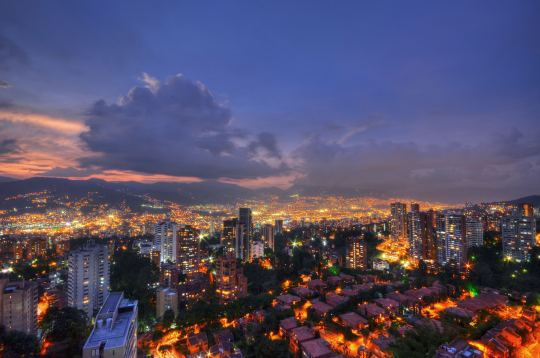
    This is an interesting working paper by a team of researchers at NYU’s Marron Institute of Urban Management. The paper examines the relationship between urban density and organized violence, first in Colombia and then within a sample of 200 global cities.

    The finding is that organized violence actually increases the population density of the surrounding areas within a city because it creates a kind of “invisible wall” – effectively a no-go zone.

    This makes perfect intuitive sense, but it’s not something I ever considered. Geography and other natural constraints typically drive density. Think about the island of Manhattan. But so too can invisible walls.

    For the full working paper, click here.

    Photo by Joel Duncan on Unsplash

  • The Korean Peninsula

    I just spent the last 7 minutes listening to this brief historical overview of Seoul by The Urbanist, while I bounced around the city on Google Street View, admiring the coverage of their transit network and the density of their low-rise neighborhoods. 

    I love Street View and I love using it to explore cities.

    One of the things I liked about The Urbanist episode –  beyond it being a good soundtrack while I explored – is that it talks, albeit briefly, about why Seoul is located where it is today. 

    I am always curious about this when it comes to cities. I mean, who was it that decided, yup, this is going to be the spot. Because it’s generally a pretty sticky decision once it is made.

    You may also find this 2014 NASA photograph of the Korean Peninsula interesting. The nighttime sky renders up a pretty stark contrast between North Korea and South Korea.

    According to NASA, per capita power consumption in North Korea and South Korea is 739 kilowatt hours and 10,161 kilowatt hours, respectively. That’s why the satellite photo looks the way it does.

  • New London Plan released today

    A draft version of the new London Plan was released today for public consultation. It is “the spatial development strategy for Greater London”. And you can download all 524 pages of it, here. A final copy of the Plan is expected to be published by fall 2019.

    Here is what mayor Sadiq Khan had to say about the Plan (quote from The Guardian):

    “I am using all of the powers at my disposal to tackle the housing crisis head on, removing ineffective constraints on homebuilders so we make the most of precious land in our capital.”

    And that tone comes through in the document. Here is an excerpt from the “optimising housing density” policy section:

    “For London to accommodate growth in an inclusive and responsible way every new development needs to make the most efficient use of land. This will mean developing at densities above those of the surrounding area on most sites. The design of the development must optimise housing density.” (Section 3.6.1)

    The Plan also contains a set of clear performance indicators. They cover things like the supply of new homes, the supply of affordable homes, modal share in the capital, and so on.

    The ambition is 66,000 net additional homes each year. And by 2041, the goal is that 80% of all trips in London will be by foot, cycle, or public transport. There simply isn’t road the capacity.

    Which is why the plan also specifies parking maximums, as opposed to parking minimums. The Plan wants the starting point for any development that is well-connected to transit – or to future transit – to be “car-free”.

    If you have a chance, the new London Plan is worth a scan. Maybe you don’t want to print it though.

    Photo by Rob Bye on Unsplash

  • MONAD, Vancouver

    image

    Earlier today, Nithya Vijayakumar, of The Pembina Institute, pointed out the above housing project to me on Twitter through this 2013 Dwell article (worth a read).

    The project is called MONAD and it’s a 4-unit, 12,600 square foot prefabricated multi-storey building in Vancouver on West 4th Avenue. 

    The site itself is 33′ x 110′, which just so happens to be the same size as a typical single family lot in the city. However, this one sits on a main street.

    Completed in 2011 and designed by Lang Wilson Practice in Architecture Culture, the development was intended to be a pilot project and a rethink of urban living.

    There are real diseconomies when you develop at this scale, but if you make it high-end enough the math just may work. What a beauty.

    Above image from LWPAC. More photos here

  • The Hong Kong window ledge

    image

    My friends at the architecture practice Valente Rodgers told me something fascinating about the Hong Kong real estate market last night. Both partners worked as architects in Hong Kong for a number of years.

    In Hong Kong, you’re allowed to deduct certain projecting windows from your calculation of Gross Floor Area

    This is provided they’re a certain height above the finished floor level, they don’t project beyond certain distances from the outer face of the building’s structural elements, and so on. The precise measurements seem to vary depending on things like the building’s use.

    Since space is such a precious commodity in Hong Kong, it shouldn’t surprise you that lots of developers and architects take advantage of this. The result being a proliferation of these projecting window ledges all across the city. 

    It’s a phenomenon that happens in many cities when a perfectly legal loophole is found in the land use policies.

    In Toronto it used to be solariums. You could also deduct these from your overall GFA, which means a lot of them them got built in condos and apartments of a certain vintage.

    In New Orleans it was the camelback house. These were houses with a single storey toward the street and a second storey toward the rear of the property. This was done because property taxes were assessed based on the height of the house as it met the street. Pushing the density toward the rear of the lot meant homeowners weren’t taxed more. 

    I find these outcomes fascinating because they have absolutely nothing to do with architectural intent and everything to do with trying to optimize within a given framework.

    But what’s even more interesting about the Hong Kong example are some of the downstream externalities.

    Firstly, it sounds to me like these projecting windows have become a normal part of underwriting projects in Hong Kong. Meaning, if you don’t factor in these projections, you’re effectively giving up free GFA. (Can anyone familiar with the HK market confirm this?)

    However, building these projections also means you can’t do unmodulated and clean floor-to-ceiling windows. And if that’s the desired aesthetic, somebody has got to be willing to pay for that “luxury.” So arguably there’s a socioeconomic dimension to having and not having this ledge.

    Secondly, because space comes at such a premium, these ledges are fully taken advantage of and furniture makers have responded by designing pieces that can dovetail with them.

    Below is a photo of a bedroom in Hong Kong that I found on bohemia.life:

    image

    This may be a custom bed and I don’t know how deep that window projection is, but it begins to show you how valuable these ledges can be from a space perspective.

    I think we should try and come up with a name to describe these sorts of built form phenomena. If you have any ideas, please drop them in the comments below. And if any of you are familiar with the HK market, let me know if I’m off the mark with any of the above.

    Photo by Jason Wong on Unsplash

  • New York and Toronto population densities compared

    Today I came across this Reddit talking about how few census tracts there are in the United States with a population density greater than 150,000 people per square mile. 

    Basically, there’s a bunch in New York, one in San Francisco (Tenderloin), and one in Chicago that doesn’t really count because it’s an unusually small tract. Most other American cities don’t even come close.

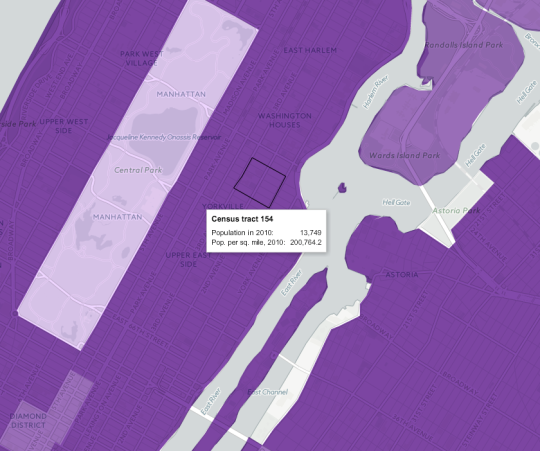
    Looking at this New York Times mapping of the 2010 US census data, it turns out there are neighborhoods in NYC that go well beyond 150,000 people per square mile. Here’s one census tract (#154) at just over 200,000 ppsm:

    If you convert 200,764 into the globally accepted standard for measuring distances and areas, you get approximately 77,515 people per square kilometer. Pretty dense.

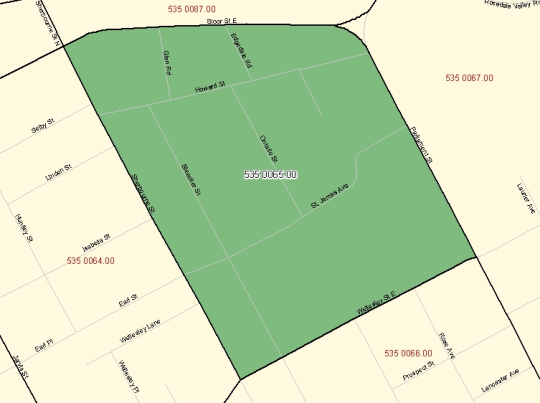
    As a comparison, I thought I would see how this number stacks up against what is commonly referred to as the densest neighborhood in Canada: St. James Town

    If you pull up that geographic code in the 2011 Canadian census data (#5350065.00 in case you’re that nerdy), you’ll see a map boundary that looks like this:

    And you’ll also find a 2011 population density of approximately 60,915 people per square kilometer. Also pretty dense – though the population did decline from 2006.

    Now obviously St. Jamestown is only one example. The rest of the city is, by and large, far less dense. But maybe when our 2016 census data gets released next year, we’ll find that we’ve become even denser. I suspect we will.