Daily insights for city builders, delivered every morning at 6 AM ET. I’m Brandon Donnelly — a Toronto-based real estate developer and founder of Globizen. I’ve been writing here since 2013.

Tag: data

  • Autonomous vehicles are already safer than human-driven ones

    Waymo has started releasing statistics for its autonomous vehicles. Here’s the link.

    There are a number of important considerations when comparing human-driven and autonomous vehicles. For instance, the two have different definitions of a crash. AV operators have to report any kind of physical contact (property damage, injury, or fatality). Human-driven cars, on the other hand, don’t typically report accidents unless it was bad enough to necessitate a police report. So there are nuances to keep in mind.

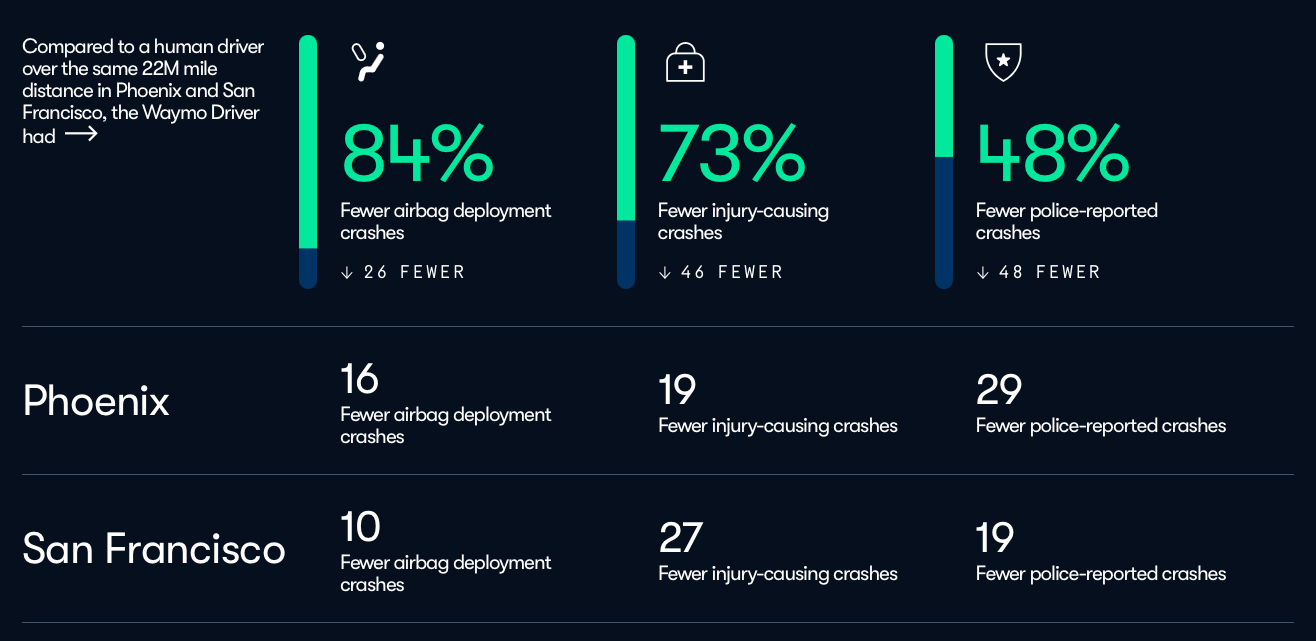
    That said, there is an argument to be made that AVs are already safer than human-driven ones. Through to June 2024, Waymo had already logged over 22 million rider-only miles. And here is what it is now reporting in terms of airbag deployments, injury-causing crashes, and police-reported crashes:

    All of them are lower than their respective benchmark crash rates.

  • Writing business memos

    One of the important things that I remember them drilling into our heads in business school was about how to write a business memo. This might not seem like a big deal, but it is. Emails, decks, and recommendations are ubiquitous in business.

    I remember three main points.

    One, use clear and concise writing. If you can use fewer words, do that. Two, be decisive. In fact, they used to tell us that being decisively wrong was always better than being vaguely correct. And three, be as quantitative as possible.

    If you can replace words with numbers, you should do that. For example, instead of saying that something recently increased significantly, it is far more effective to say that something increased by 27% over the last 18 days.

    I was reminded of this earlier today when I came across this:

    Supposedly, it is what Amazon used to tell its employees back in 2018. I don’t know the source, but the tips sound right and make sense. Be concise. Use data. Eliminate weasel words. And make sure you’re communicating a “what”. In other words, be decisive.

  • Distribution of trips by distance across the US

    The US Bureau of Transportation Statistics has just published some recent data looking at average trip distances across the country. What it allows you to do is drill down to the county level and see exactly how many trips people take that are less than 1 mile, between 1-3 miles, between 3-5 miles, and so on. This is interesting, in my view, for two reasons.

    One, it showcases the fact that most of our trips tend to be short ones (a trip is defined as being away from your home for more than 10 minutes). If you look at the data you’ll immediately see this, which is, of course, a pretty good argument for trying to encourage other forms of mobility besides driving.

    And two, it is yet another example of how much data our mobile phones are constantly off-gassing. I mean, how do you determine where someone’s home is so that you know when they’re taking a 10 minute trip away from it? You figure out where their phone spends long periods of time (particularly at night) and you likely have that person’s home.

    What would be even more interesting to see is how this data correlates with built form. In other words, to what extent are higher densities inversely correlated with trip distances? This should certainly be the case, but it would be cool to see the data.

  • New land development across the US between 2001-2019

    The Washington Post just published this interactive feature showing new developed land (i.e. urban sprawl) across the US between 2001 and 2019.

    It is based on these land cover maps which were published by the US Geological Survey earlier in the summer. Their findings show that between 2001 and 2019, more than 10% of the land cover in the lower 48 states changed during this time period. Mostly in forested areas.

    The WP feature allows you to search by city/address and I would encourage all of you to try it out. As an example, here is Salt Lake City. The gray areas represent land that was already developed in 2001. The purple areas represent land that was developed sometime between 2001 and 2019.

    Images: Washington Post

  • Percentage of young Americans now living with a parent

    Here’s some data from the Pew Research Center looking at the percentage of young people (18- to 29-year olds) in the US that live with at least one parent. It it based on an analysis of monthly Census Bureau data and is obviously interesting/relevant given that this pandemic seems to have precipitated a number of people moving back home. As of July of this year, 52% of young adults were thought to be living with at least one parent, which is up from 47% back in February.

    At first I was surprised to see these numbers as high as they are. But it’s really the 18-24 age bracket that is driving this number up, which makes sense given that a chunk of this demographic is probably in school, not working, and now unable to do much on a campus. Among 25- to 29-year olds, the range is significantly lower, with just over a quarter (26% -> 28%) living with their parent(s).

    What I’m curious about now, after seeing this chart, is what is driving some of these regional, ethnic, and gender differences? Why are young midwesterners seemingly less likely to live with a parent compared to those in the northeast? Is it cultural? Economic? Or something else? And is the above an indication that maybe women are more independent than men?

  • Tasty data

    A recent study and research paper by the MIT Senseable City Lab — called, Tasty Data — has discovered that restaurant data alone can be used to accurately predict location-based factors such as daytime population, nighttime population, number of businesses, and overall consumer spending within a specific geography.

    They started by pulling restaurant data from Dianping (Chinese equivalent of Yelp) for 9 Chinese cities: Baoding, Beijing, Chengdu, Hengyang, Kunming, Shenyang, Shenzen, Yueyang, and Zhengzhou. They then paired their Dianping data with other available data (such as aggregated mobile phone data) and used machine learning to search for any correlations.

    Below is a diagram of “nighttime population” in Beijing. They are using a 3 km2 grid.

    If you’re a regular reader of this blog, you’ll know that I like these kinds of studies. By 2020, it is estimated that 1.7MB of data will be created every second by every person on earth. The numbers are staggering. And yet, “official” data sources, such as census data, remain slow and fairly limited. Studies like this one continue to show us what’s next.

    Image: MIT Senseable City Lab

  • More than 1 in 4 Americans now live alone

    The percentage of single-person households in the US has been steadily increasing since the 1960’s (though the rate of increase has moderated in recent decades). As of last year (2018), 28% of Americans lived alone, according to the US Census Bureau. So about 1 in 4 households. This is in comparison to 13.1% of households in 1960.

    Here is a chart from a recent WSJ article on the topic:

    Not surprisingly, this is changing how marketers target households. Affluent, single-person households in urban areas have proven to be a boon to product makers because they tend to spend more per person and they tend to value time > money. Of course, this phenomenon also has implications for those of us who work as city builders.

    For more historical household tables from the US Census Bureau, click here.

  • Price of a new condominium in Toronto increased 12.5% over the last year

    This morning BILD and Altus Group released their January 2019 new home sales figures for the Greater Toronto Area.

    Here are the highlights:

    • 1,362 new homes sold in January 2019 across the GTA. This is up 14% compared to last January.
    • Of these, 942 (~69%) were condominiums (includes low, mid, and high-rise, as well as townhouses). And 420 (~31%) were single-family homes (includes detached, semi-detached, and freehold townhouses).
    • Condominium sales volume is sitting only about 5% below the 10-year average and the benchmark price increased this month to $803,638, which represents a 12.5% year-over-year increase.
    • On the other hand, single-family home sales are down about 53% from the 10-year average and the benchmark price decreased by about 8.1% compared to last year. It is sitting at $1,130,046.

    While there continues to be a bifurcation in the new home market, we are seeing improvements across the board and the data is consistent with Altus’ prediction that 2019 will see an increase in overall sales.

    It is also important to consider how geography might factor into the above numbers. Here are the January sales numbers for the last three years broken down by region within the GTA:

    Just under 80% of the new condominiums sold last month took place in Toronto, whereas only about 1.2% of the single-family homes sold last month took place in the city. You can count them on one hand. There were only 5.

    So rather than just look at this in terms of housing type, I think the other way to interpret the data is that it could suggest strong and continued demand for centrally located and transit-oriented communities.

    And that just so happens to translate into a condominium.

    Photo by Eugene Aikimov on Unsplash

  • Apple now owns 7,376 acres of land

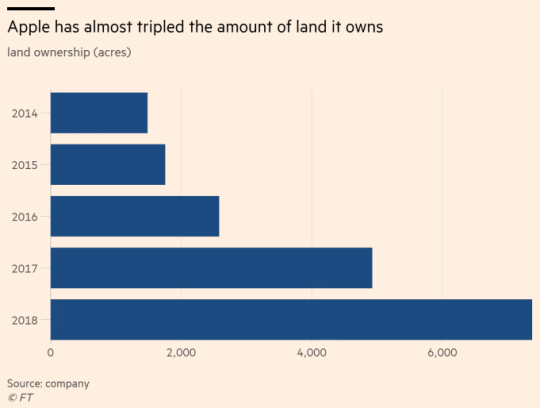
    In 2011, Apple owned 584 acres of land.

    As of this year, and according to the Financial Times, the company now owns about 7,376 acres. 

    Apple uses its “facilities and land for corporate functions, R&D and data centres.” The latter would include server farms for its various online services, such as iMessage, Apple Music, and the App Store.

    It can be easy to think of “the cloud” and the online services we use every day as existing only in some ethereal world up in the sky or in a distant land.

    But the reality is that these services have very real physical space requirements. The above chart begins to speak to that.

  • #DeleteFacebook

    Earlier this week I deleted my Facebook account. If we were friends on the service and you can no longer find me, this is the reason why. 

    Part of why I did this certainly had to do with privacy. I read Brian Acton’s (WhatsApp cofounder) account in Forbes this week. And I have been following many of the discussions over the past year:

    Privacy legislation is perhaps the only thing that could pose an existential threat to a business that’s entirely powered by watching and recording what people do at vast scale. And relying on that scale (and its own dark pattern design) to manipulate consent flows to acquire the private data it needs to profit. –Natasha Lomas

    But at the same time, I’m still on and use Instagram and WhatsApp (both Facebook companies), and I use Twitter pretty much every day.

    So I am certainly not in a position to be smug about this decision. Hopefully this post does not come across that way.

    The simple truth is that I had more or less stopped using the service. I had long ago turned off mobile notifications and so it had become more of a hassle than anything else.

    Every now and then I would go on and find notifications and messages that I wasn’t responding to. 

    So it had finally reached a point where I thought to myself: Why keep my data here (by the way, you can download all of your data from the site) and why check it sporadically if I’m not really deriving any value out of it? Simplify.

    I enjoy Instagram because taking photos is one of my primary passions outside of real estate and design. And I enjoy Twitter as a source of news and mostly civil conversation. 

    I am easy to get ahold of. I don’t need Facebook for that. Any of the social links at the top of this page (if you’re reading this post on the web), will get you there.