Daily insights for city builders, delivered every morning at 6 AM ET. I’m Brandon Donnelly — a Toronto-based real estate developer and founder of Globizen. I’ve been writing here since 2013.

Tag: city planning

  • Crypto networks and top-down urban planning

    Taylor Pearson recently compared crypto networks to cities and argued that the best crypto networks, much like the best cities, are formed from the bottom up. 

    The example he gives is that of Paris (bottom-up) vs. Brasilia (top-down). Paris is the hugely successful city and Brasilia is the failure of high-modernism.

    I appreciate the argument he’s making and I do agree with him on the potential of decentralization, but I couldn’t help but dig into his city example a bit further.

    The Paris we all know and love today is the result of an enormous centrally planned urban renewal exercise. Baron Haussmann carved, among many other things, long straight boulevards through Paris’ medieval fabric in order to modernize and rationalize the city.

    What makes this top-down exercise different from that of Brasilia’s? Is it simply that Haussmann was constrained by Paris’ existing and decidedly urban fabric?

    Because then we could turn our attention to New York City’s gridiron plan of 1811, which laid out – before the island of Manhattan had even fully developed – a relentless and orthogonal street network from Houston Street all the way up to 155th Street.

    Is the difference that Brasilia was planned with suburban sensibilities in mind and Manhattan was not? Or was it the restrictive Euclidean zoning that did it in for Brasilia? 

    Whatever the case may be, history suggests that some top-down planning exercises may have worked out just fine. Though to be fair, each of them was not without their share of critics.

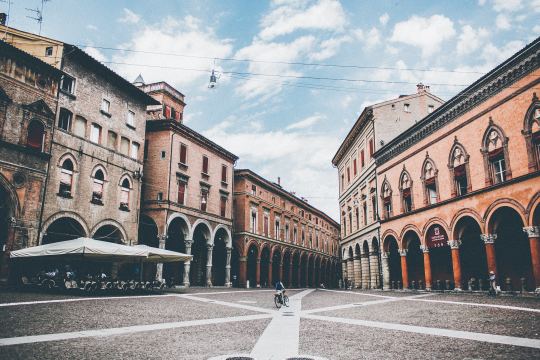
    Photo by Rafael Leão on Unsplash

  • Neighborhood depopulation

    Recently we’ve been talking about California’s Proposition 13 and how it may be creating a disincentive for longtime homeowners to move. They’re enjoying below market property taxes, and so they stay put, even if they may have too much house.

    But this concept of “overhousing” isn’t unique to California. The Globe and Mail just ran a piece talking about how Toronto’s designated “Neighborhoods” are losing people as the nests empty out, seniors remain put, and the broader city booms.

    The rate of depopulation that created the spare bedrooms in Toronto’s low-rise neighbourhoods is stark: “Since 2001, about 52 per cent of the land mass of Toronto has reduced in density of population by about 201,000 people,” Mr. Smetanin says. “Other parts of Toronto have grown by 492,000.”

    The irony of this phenomenon is that the city’s Official Plan considers these Neighborhoods to be “physically stable”, as well as “one of the keys to Toronto’s success.” However, things are clearly changing behind that physical stability.

    Photo by Verne Ho on Unsplash

  • Good morning Hong Kong

    image

    It’s about 6:30 am on new year’s eve day and I’ve been awake since around 4:00 am because of jet lag. I initially resisted, but now I am up and starting my day. 

    The coffee shop downstairs doesn’t open for another hour so this is coming to you live from my surprisingly spacious hotel room. (I’ve been in far smaller both here in Hong Kong and in New York.) There’s a wide array of teas available in this room, but sadly no coffee. I could go for a coffee right now.

    I took the express train in from the airport last night, which is what I did the last time I was in Hong Kong over a decade ago. It takes just over 20 minutes and it is a great way to get into Central. It immediately signals to you that this city thinks and cares about efficiency.

    The experience of landing and getting into a city is an important, but often neglected, consideration. For many people this is their first impression of a place and so it only makes sense to pay attention to it. 

    Think of it like fine dining. Most nice restaurants will greet you at the front, take your coat, and show you to your table. Few expect you to come in the backdoor and wander bewildered through the kitchen. But that’s what some cities ask you to do after you land.

    Come to think of it, I left Toronto aboard our own airport express train. That’s standard practice for me. And so I started and ended my 2-day journey on efficient rail. I’m good with that.

    Before signing off for today, I would like to apologize for missing yesterday’s post. I was in the air for over 19 hours without internet. I also didn’t have much to say. As always, you should expect me to show up here every day. But expect more travel-related posts over the next week to go along with my Instagram posts.

    I would also like to point you toward this tweet storm by Shawn Micallef (discovered during jet lag haze). Please do me a favor and check it out. It is a hilariously accurate satire about many of the city building challenges that cities face today, told by way of a miniature “Dickens Village.”

    https://platform.twitter.com/widgets.js

    And with that, I wish you all a happy new year. See you on the other side. Bring on 2018.

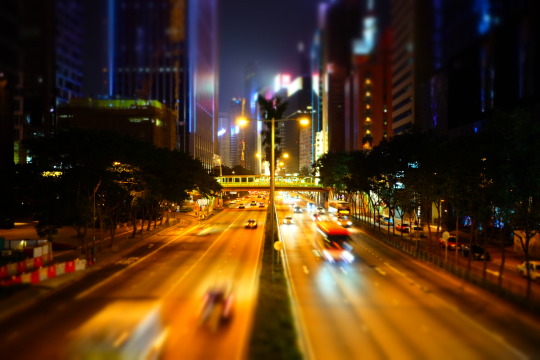
    Photo: Night shot of Gloucester Road from pedestrian overpass

  • The public life data protocol

    The Gehl Institute has just launched (in beta) something called the Public Life Data Protocol. It was developed by the Institute, as well as by Gehl (the practice), the Municipality of Copenhagen, the City of San Francisco, and Seattle’s Department of Transportation.

    The goal of the protocol is to improve the way in which we collect, share, and compare public space information. It is about improving public life in public spaces.

    To do this, they have proposed a series of metrics that measure everything from “posture within the space” to “objects brought into the space.” They also propose spatial metrics that help to analyze public life in relation to its physical context.

    Gehl is a real leader in this space. I commend them on opening up their methodology and working to create “a common language for people data.” Great data will only help us to build more human-centered cities.

    To download a full PDF of the protocol, click here

    Photo by Thaddaeus Lim on Unsplash

  • Thickets of haphazardly planned condo towers

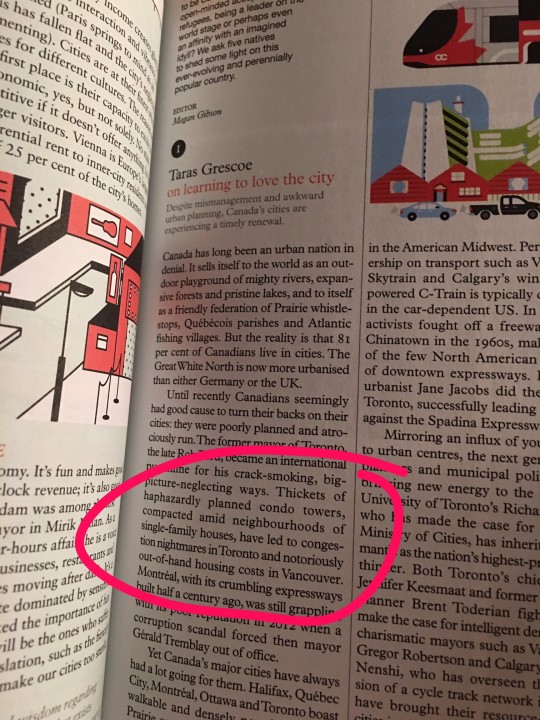
    I couldn’t sleep last night, so I got up and pulled out an old issue of Monocle magazine from my nightstand. I then stumbled upon the following article by Taras Grescoe.

    What really stood out for me was this line:

    “Thickets of haphazardly planned condo towers, compacted amid neighbourhoods of single-family houses, have led to congestion nightmares in Toronto and notoriously out-of-hand housing costs in Vancouver.”

    It bothered me for a few reasons:

    – The frame of reference is the single-family house. It perpetuates the cultural bias that what matters most in cities, like Toronto and Vancouver, is low-rise housing.

    – I don’t get the “haphazardly planned” comment. New tower development has been heavily concentrated in the downtown core, growth centers, along the Yonge subway corridor, and so on. Their built form is also significantly influenced by their relationship to these low-rise “Neighbourhoods.”

    – I believe that building up, as opposed to out, is the way to address congestion nightmares. Though I will concede that our ability to plan and execute on transit in this city is positively deplorable. 

    – How did thickets of condos create an affordability problem in Vancouver? Many factors at play in this city, including a powerful geographic supply constraint.

    Those are just a few of my thoughts from early this morning. What are yours?

  • 3 pilot options for Toronto’s King Street corridor

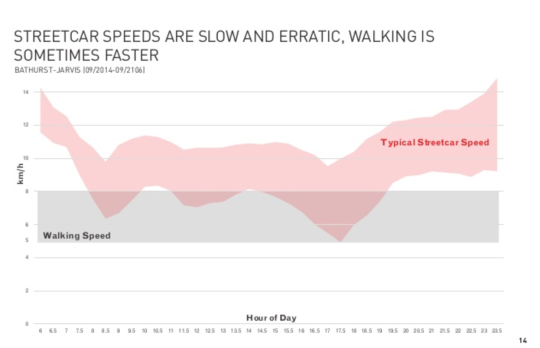
    Anyone who has ridden Toronto’s King streetcar during rush hour can tell you that the service is broken. It’s unreliable. It’s overcrowded. And during peak times it can be faster to walk. Chart below.

    Part of the problem is a misallocation of resources. Only 16% of the people who use the corridor are in cars. And yet 64% of the physical space is allocated to drivers.

    Not surprisingly, this creates a bottleneck for the ~65,000 transit riders who use the service daily. (Busiest surface route in the region.) We are not optimizing for the right variable.

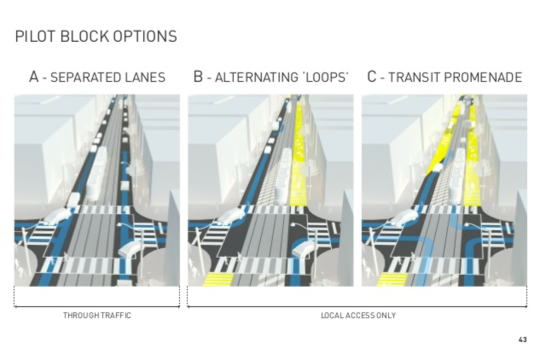
    It’s for this reason that the city is working on a rethink of the corridor. I wrote about this initiative last year, but earlier this week it got a bit more real with the release of the following 3 pilot block options.

    The plan is to launch a pilot sometime this fall (2017). This is good news. 

    If you’d like to go through the full King Street Pilot Study Public Meeting presentation, you can do that by clicking here. The above images were taken from that presentation.

  • Designing for families in high-rises

    The City of Toronto Planning Division is working on an initiative called, Growing Up: Planning for Children in New Vertical Communities

    The objective is to better understand how new multi-unit housing can better accommodate families within the city. Supposedly as of 2011, 32% of families within Toronto lived in mid and high-rise buildings. At first I thought this number seemed high, but then I rationalized it to myself by thinking of all the post-war apartment buildings we built.

    As part of their study, the city published a number of case studies from Toronto and from around the world. These are projects that have successfully planned for families. For some of the projects they have floor plan and sections showing how the individual suites were designed and positioned within the building. One feature that they consider desirable is to cluster the family suites on the lower floors of the building.

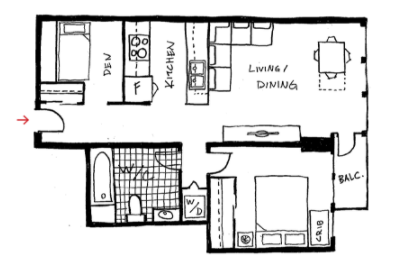
    But perhaps even more interesting is the section called CondoHacks. Here, the study team interviewed 9 families already living in vertical communities to learn about how they have “hacked” their spaces to meets their needs. It’s valuable to see how end-users actually live in specific floor plans. Lots of shared bedrooms and spaces. Here (pictured below) is an example of 2 parents and 2 children living in a 650 square foot one 1 bedroom plus den.

    image

    This a topic that I’m personally very interested in. I’m thinking a lot about how some of the projects I’m working on could better accommodate families. So it’s great to see this initiative underway. If you’d like to receive email updates from the city about this study, sign up here on the bottom right of the page. I did that this morning.

  • Driving in the HOT lane

    image

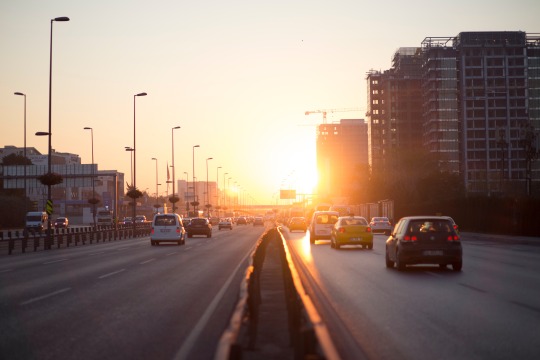
    Joe Cortright of City Observatory recently published an interesting post on HOT lanes (high-occupancy toll lanes) and cited a research paper by Austin Gross (University of Washington) and Daniel Brent (Louisiana State University). The paper looked at the behavioral response of drivers to dynamic HOT lane pricing. 

    They way HOT lanes work is simple: when traffic is light, the price dynamically decreases; when traffic is heavy, the price dynamically increases to ensure a minimum level of service. That is, the price increases until enough cars leave the lane and driving speeds increase to some minimum threshold. In this case, it’s 45 mph.

    The key takeaway from the report is that “value of reliability” appears significantly more important to drivers than “value of time”. Put differently: it’s less about the time I’m wasting in traffic and more about the uncertainty of not knowing when I’m going to arrive at my destination.

    It’s for this reason that HOT lanes are used more frequently in the morning (when you’re running late for that meeting) than in evening (when you’re just on your way home from work). 

    Gross and Brent estimate that the spread is about 7.5x. The typical driver values saving time at about $3 per hour and reliability improvements at about $23 per hour! This is fascinating because we tend to focus a lot on time. But arguably what people really want to buy is greater certainty.

    I can tell you that it’s definitely one of the things that I love about walking to work, or for that matter cycling somewhere. I always know how long it’s going to take.

  • The suburban Ponzi scheme

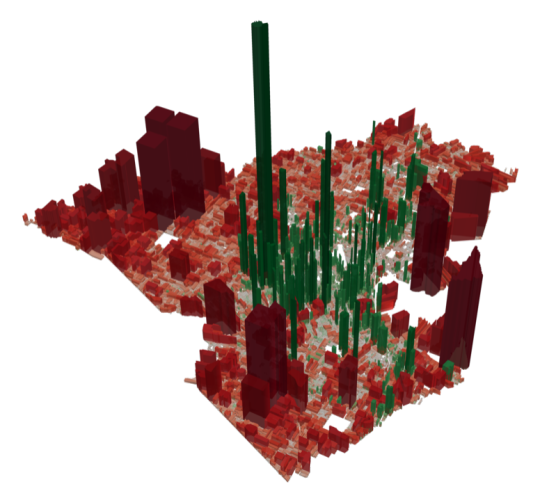
    The following image is a geographic representation of Lafayette, Louisiana’s finances. It is from this excellent article by Charles Marohn.

    What this 3D map shows is the city’s revenues and expenses by land parcel. The green areas are where the city is making a profit (revenues exceed expenses) and the red areas are where the city is operating at a loss (expenses exceed revenues). The height of each extrusion indicates just how much profit is being made and how much loss is being incurred.

    The glaring takeaway from this study is this: not only are post-war land use patterns environmentally unsustainable, but they are also fiscally unsustainable. The tax base is simply not there to pay for the infrastructure that gets built alongside it.

    They – the authors of this study – estimate that the infrastructure revenue gap for the median home in Lafayette is about $8,000 per year (median household income is $41,000). And yet despite this shortfall, it is common to look at infrastructure spending as a desirable economic stimulus.

    The following paragraph really brings this point home:

    “All of the programs and incentives put in place by the federal and state governments to induce higher levels of growth by building more infrastructure has made the city of Lafayette functionally insolvent. Lafayette has collectively made more promises than [it can] keep and it’s not even close. If they operated on accrual accounting – where you account for your long term liabilities – instead of a cash basis – where you don’t – they would have been bankrupt decades ago. This is a pattern we see in every city we’ve examined. It is a byproduct of the American pattern of development we adopted everywhere after World War II.”

    Thank you Daniel for sharing this article with me. 

    If you only read one other thing today (besides my blog), I recommend you read Charles’ article. It’s called: The real reason your city has no money.

  • Uber Movement

    Uber just announced that it will be providing access to the (anonymized) traffic flow data generated from its over 2 billion rides. This new product is called Uber Movement and the goal is to help cities make better infrastructure decisions. Because indirectly, that also benefits them. 

    Here’s an excerpt from TechCrunch:

    “We don’t plan infrastructure, we don’t plan cities, we’re never going to do that,” explained Uber Product Manager Jordan Gilbertson in a briefing. Not controlling those aspects of Uber’s business means that it must do whatever possible to influence their improvement indirectly, which Movement can certainly help to do. More efficient transportation in a city in general means more efficient Uber service delivery, happier customers and better usage rates.

    You can request access to Uber Movement today. But the service will be made available first to city planners and policymakers, and then to the general public. I would be very curious to see what the data reveals for Toronto, as well as for other cities.