Daily insights for city builders, delivered every morning at 6 AM ET. I’m Brandon Donnelly — a Toronto-based real estate developer and founder of Globizen. I’ve been writing here since 2013.

Tag: cities

  • The vertical city

    We often talk about agglomeration economies in terms of their horizontal clustering within cities. But a new paper in the Journal of Urban Economics – summarized here by Richard Florida – has looked at the other dimension: the vertical clustering of economic activity within tall buildings. 

    Here is an excerpt from Florida’s piece in CityLab:

    Economic activity is also sorted vertically, with higher-profile and more profitable firms occupying higher building floors. Law offices are disproportionately represented on the highest floors, taking up more than a third of floor space above the 40th floor, compared to 12 percent of floor space between the second and 40th floors. Finance, insurance, and real estate take up roughly 20 percent of floor space above the 40th floor, compared to 23 percent between the second and 40th floors. Business services, engineering, and miscellaneous other industries are also more likely to take up more space below the 40th floor.

    The other takeaway is that there appears to be a greater rent premium attached to higher floors (vertical movement) than for being located closer to the central business district (horizontal movement). This surprised me. But I also don’t have access to the full paper. Is the dataset just US cities?

    Nevertheless, the idea of a vertical city interests me a lot. And I agree with the authors of the report that, for perhaps obvious reasons, it is far less studied compared to horizontal development patterns.

  • The blue (real estate) bible

    Back when I was in grad school studying real estate, we used to refer to the below book as the “blue bible.” It is a comprehensive look at real estate finance and investments, and also development. But perhaps more importantly, it is written in a way that is clear, direct, and immensely practical to the actual world of real estate.

    image

    The reason I mention this today is because the fifth edition is out and my friend Bruce Kirsch is now an author, along with Peter Linneman. Thankfully the cover is still blue, otherwise I might be a little sad and this post wouldn’t make a lot of sense.

    Bruce has an MBA in Real Estate from Wharton (at Penn) and is the founder and CEO of Real Estate Financial Modeling, LLC, which I recommend to absolutely everyone who wants to get better at financial modeling and deal underwriting.

    I have a lot of people who reach out to me on a regular basis and want to ask me about getting into real estate, and in particular, development. I try my best to make time because I was once in their shoes. Usually that means an early morning coffee in Toronto’s PATH.

    My advice is fairly consistent. You have two options. Try and get your foot in the door at a shop or, if you’ve got the gall, go out and try and do it on your own. I have friends who have successfully done the latter with very little in the way of formal real estate training.

    Whatever your decision, knowledge of the industry will obviously serve you well. Oftentimes I’m meeting with design and/or planning professionals who bring a lot to the table, but usually lack the finance and investments knowledge. That’s when I remind them of my story: Don’t screw up the numbers.

    This is also when I suggest taking one of Bruce’s classes. I’ve taken a number of them. Because to learn how to model something in Excel you have to understand how it actually works and Bruce helps you do exactly that. Garbage in, garbage out. That’s how models work.

    But the other thing one should consider doing is picking up a copy of the blue bible. I have a copy sitting on my desk right now and will tell you that it’s a “must read”, whether you’re a designer and just want to learn more about the other side of the business, or you’re an experienced real estate professional.

    For more on the book, click here and then on Textbook at the top. Oh, and Bruce, congratulations on the new book!

  • Toronto’s great streets

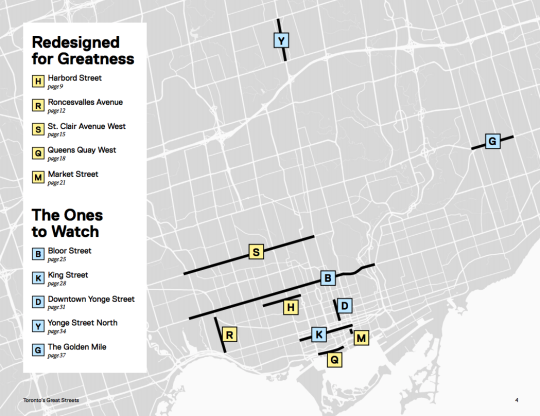
    Last week the Ryerson City Building Institute published a terrific report on Toronto’s Great Streets. It profiles five streets in the city that have been “redesigned for greatness.” They are:

    • Harbord Street (continuous bike lanes)
    • Roncesvalles Avenue (placemaking and people)
    • St. Clair Avenue West (dedicated streetcar lane)
    • Queens Quay West (public waterfront promenade)
    • Market Street (prioritized for people and patios)

    But what exactly makes a street a great one? The report describes it in this way: “They all play a key role in making the surrounding neighborhood a great place to live, work, and visit.”

    This relates closely to what the City of Toronto calls a “complete street”, which is an approach to accommodating multiple kinds of users, enhancing the local context, and determining which trade-offs to make.

    And there will always be trade-offs. I am fairly certain that all of these street redesigns were contentious at the time when they were proposed. Because at the end of the day they will never be all things to everyone.

    I remember the St. Clair West fight vividly because I moved to the neighborhood in 2009 and the dedicated streetcar lane didn’t fully open until 2010. From 2005 to 2017, streetcar ridership grew 23%. But drivers have remained grouchy.

    I now walk Market Street every single day and I agree that it’s one of the most beautiful and functional streets in the city. But the bollards are constantly getting beat up by drivers attempting to parallel park and the retail vacancy rate has not been 0% like is suggested in the report.

    Queens Quay West is also a magnificent street. It was a giant step forward in terms of the quality of the public realm in this region and I spend a lot of time there. But it’s of course not perfect. All of us have seen the reports of cars ending up in odd locations, including underground, along the waterfront.

    Riding your bike there can also feel like a challenging game of Frogger with all of the pedestrians that now obliviously meander back and forth across the cycling trail. I suggest riding with a good blow horn. The report rightly mentions the lack of delineation between these users.

    But cities are a living laboratory and none of these streets should now be considered static. We are fortunate to be in a position to critique levels of greatness. If anything, the map at the top of this post tells me that we need to create more greatness across the other areas of this city.

  • Learning about O-zones

    I spent this evening reading about Opportunity Zones, or “O-zones”, in the United States. 

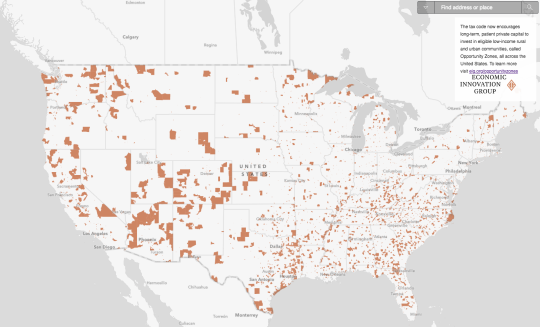
    For a census tract to become an O-zone, it has to have a poverty rate of 20% or higher, or the median household income has to be less than 80% of the surrounding area. Governors are also only able to designate 25% of their eligible census tracts.

    Here is a map of the areas that have been designated as Opportunity Zones.

    image

    Here is how these O-zones work. (All excerpts taken from this Forbes article.)

    The law’s engine is a new breed of financial product, the opportunity fund, that offers investors a trifecta of attractive tax breaks. Here’s how it works. Investors who sell assets have 180 days to plow their taxable capital gains into an approved opportunity fund, which must hold 90% of its assets in Opportunity Zone projects. To put money to work fast, the law requires that the funds invest all of their cash within some specified time frame. (The Treasury Department is still deciding on that and other crucial details.) Tax on the original reinvested gain isn’t due until 2026, and the taxable gain is cut by 15%. Meanwhile the new opportunity investment grows tax-free, like a Roth IRA, provided it’s held for at least ten years. (If it’s sold earlier, it can be rolled into another opportunity fund and remain tax-free.)

    Here is how it could get the real estate industry to take action.

    For real estate developers, O-zones offer cheap real estate and unlimited, untaxed upside if a neighborhood takes off. Developers must do more than stash cash in crumbling property. To qualify for tax perks, they must make swift and significant upgrades (at least equal to the cost of the initial purchase). With real estate projects come new office buildings, industrial districts, restaurants and affordable housing—all of which can lay the groundwork for an economic boom. “The real estate aspect is a great catalyst to attract new businesses,” says AOL founder Steve Case, an early supporter of the O-zone initiative, whose Rise of the Rest Fund invests in backwater areas. “But it’s the startups that will be the real job creators.”

    And here is how it could influence where new businesses decide to locate.

    “If Facebook could have chosen to locate itself in an Opportunity Zone, like the Tenderloin in San Francisco, the investors would’ve paid no capital gains on their equity,” says Parker, who presumably would have been one of the big winners. The promise of mega-returns could send VCs, investment banks and private equity firms scrambling to launch their own opportunity funds to create incubators, scour second cities for overlooked talent or move portfolio companies into O-zones. “It wouldn’t surprise me if a lot of Silicon Valley VCs started to tell founders, ‘We’d like you to go over the bridge to Oakland, or we’d like you to go to Stockton,’” Parker says.

    If you’d like to learn more about Opportunity Zones, check out the Forbes article.

  • Lyft reveals plans for bikes and scooters

    On Monday, John Zimmer and Logan Green, the co-founders of Lyft, published this Medium post announcing their “approach to partnering with cities to introduce bike and scooter sharing” to their platform. 

    “Approach to partnering with cities” is undoubtedly a carefully chosen set of words given all the backlash going on right now around dockless scooters.

    Nevertheless, this is an exciting announcement. I could have used a scooter this afternoon to get to a meeting. And this is all part of their larger goal of transforming Lyft into a multi-modal platform – one that will also support conventional public transit.

    Here is an excerpt from the Medium post:

    Transit, bikes, small electric vehicles, and infrastructure such as safe pedestrian paths and bike lanes, all play a large role in decoupling people’s right to mobility from car ownership. We know we can’t accomplish this alone, and we’re committed to working with cities and residents to bring these elements together in the most cohesive way to maximize a reduction in vehicle miles traveled.

    The company has also set the goal that 50% of all trips on the Lyft platform will be shared rides by 2020. It is yet another example of the lines between public transit and ride sharing apps becoming blurrier. 

    Full post can be found, here.

  • Why Millennial homeownership is so low

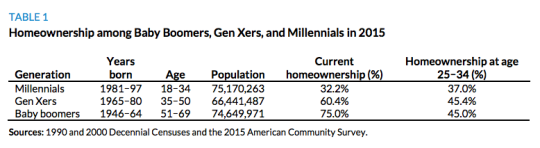
    The Urban Institute has a new study out that looks to explain why Millennial homeownership rates are lower than that of previous generations. The typical refrain is that Millennials have a lot more student debt and that the cost of housing in urban centers has risen faster than income levels. But this report tries to put some math behind those explanations. All data is for the US.

    Not surprisingly, marriage and kids are significant drivers, and Millennials appear to be delaying both. According to the study, being married increases the probability of owning a home by 18%. If marriage rates in 2015 were the same as they were in 1990 (this is the time period for the study), the Millennial homeownership rate would be 5% higher. Having a kid increases the probability by about 6.2%.

    There’s also a widening spread between the homeownership rates for more educated and less educated Millennials. Presumably the distinction is a 4 year university degree. Between 1990 and 2015, the spread between the two groups increased from 3.3% to 9.7%. This was identified as an area of “great concern” because of the possible long term implications.

    Combine this phenomenon with the stats that white households have a higher homeownership rate compared to all other racial groups and that having parents who are homeowners increases the likelihood of also owning a home (let’s ignore, for a second, the other intergenerational transfers of wealth), and you have a recipe for rising wealth disparities.

    Of course, some of you will undoubtedly argue that in this part of the world we are overly fixated on homeownership as a mechanism for wealth creation. I mean, there are many examples of very wealthy countries with homeownership rates that are far less than what they are here in Canada and the US. But that’s a discussion for a different blog post.

    If you’d like to go through the full Millennial Homeownership report, you can do that here.

  • How large metro areas are driving the global economy

    “The concentration of economic growth and prosperity in large metro areas defines the modern global economy, creating both opportunities and challenges in an era in which national political, economic, and societal trends are increasingly influenced by subnational dynamics.” -Brookings Institute

    The Metropolitan Policy Program at the Brookings Institute has a new report out for 2018 called the Global Metro Monitor.

    Here are some of the highlights (data is from 2014 to 2016):

    – The 300 largest metro areas in the world accounted for 36% of employment growth and 67% of GDP growth.

    – Metro areas in China and the Asia-Pacific region outperformed, whereas Latin American cities, and in particular the largest Brazilian cities, were weaker performers.

    – The majority of large metro areas had growth rates that exceeded that of their respective regions. So again, cities are the driver.

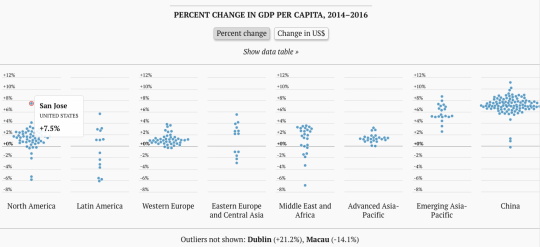
    And here is an interesting interactive chart (better to click through) that shows the % change in GDP per capita. 

    image

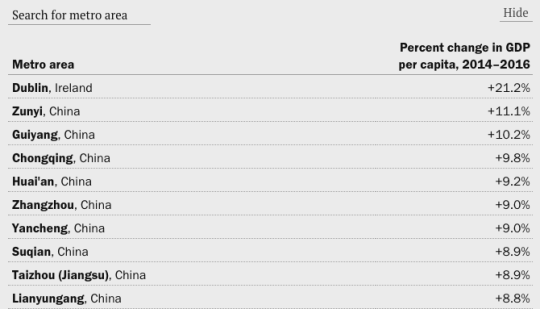
    Look at how much of an outlier San Jose is. Though, check out Dublin in the footnote. And if you look at the actual data table, it is all China, except for Dublin at the top.

    image

    For the rest of the charts, click here. And to download the full Global Metro Monitor report, click here.

  • More on One Delisle and the block

    image

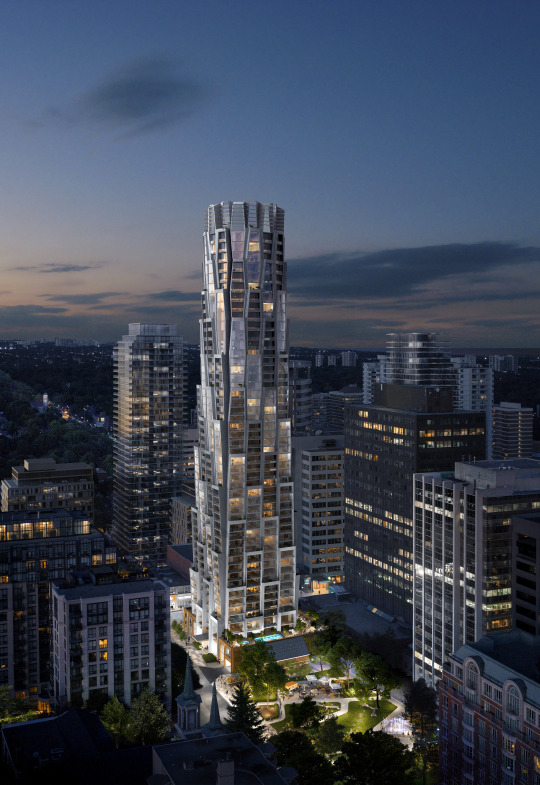
    Now that things have quieted down from last night, I would like to say that we are thrilled by the response to One Delisle and the broader ideas for the block. There was a lot of positivity last night at the open house and today the project team received countless emails and messages from people telling us that they are excited and/or looking forward to working with us over the coming years. Many were from the local community.

    image

    Following yesterday’s Globe and Mail piece by Alex Bozikovic, One Delisle was also covered in Urban Toronto (read the comments), designboom (they’re allergic to capital letters), ArchDaily, Canadian Architect, Dezeen, The Architect’s Newspaper, and probably other places that I am missing. The comments have been interesting to read and there seems to be a fatigue around boring glass boxes. This project team does not want to do that.

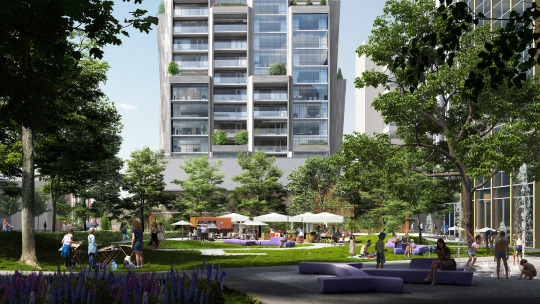
    Though the project has been making the rounds, there are two images that I don’t think have been widely shared and so I would like to do that today (below). Both were presented at last night’s open house. And they are intended to show the relationship between One Delisle and Delisle Park, which is proposed to be revitalized and expanded by ~50% as part of the project’s block and enhanced public realm strategy. Credit to ADHOC Studio for these renderings.

    imageimage

    In fact, it is important to keep in mind that while a lot of attention is being paid to the architecture of the building, there’s a broader city building strategy that is attached and integral to it:

    • Revitalize and expand Delisle Park by 50%
    • Add residential uses to a block of office buildings
    • Reduce the number of vehicular access points across the block from 5 to 3 in order to improve traffic flows in the area
    • Create below-grade vehicular connections across the block to consolidate and legitimize access/loading and once again improve traffic flows in the area 
    • Significantly widen the sidewalk along Yonge Street to eliminate existing pedestrian pinch point
    • Significantly widen the sidewalk along Delisle Avenue to strengthen connection to Delisle Park
    • Introduce pedestrian laneway with art canopy to connect St. Clair Avenue West back to Delisle Park
    • Create a unified and consistent public realm across the block and provide retail animation along its edges
    • Retain Art Deco facade along Yonge Street
    • Target the 2nd tier of the Toronto Green Standard (voluntary sustainability target)
    • Continue to explore the feasibility of district energy solutions across the block to take advantage of the different energy demand curves for office, retail, and residential uses

    Once again, a big thanks to the ~300 people who came out last night – in the rain – to engage with the project team. And a big thanks to the full project team who worked tirelessly to prepare for this week’s community open house. But as was said on Thursday night, in many ways this is really just the beginning. To stay informed about the project and to provide your feedback to the team, stay tuned to yongedelisle.ca.

    Photos: Khristel Studios

  • Letter from Toronto on Google’s city of the future

    Politico Magazine recently published this article about Sidewalk Toronto. It’s called: Google Is Building a City of the Future in Toronto. Would Anyone Want to Live There? 

    If you’re familiar with what Sidewalk Toronto is up to, the first bit will likely cover things you already know. But later on it gets into an interesting discussion around data privacy, among other things.

    One argument is that if you strip any personal identifiers from the data you collect, then you’ve effectively eliminated the issue of privacy. 

    But what about “collective privacy?” 

    What if you could, for example, identity signs of concentrated drug usage within certain districts, communities, or even buildings? Does that start to get a little too personal?

    This is the great debate surrounding Quayside, the area that Sidewalk is focused on. The article also touches on what Quayside could mean for the future of Toronto.

    Just about all players involved believe that if Sidewalk can be successful at Quayside, it has a shot at the adjoining 800-acre Port Lands, a swath of problem space big enough to become home to a dozen new neighborhoods in a growing metropolis. Townsend, the consultant, says of the Port Lands: “That’s a city they’re going to build there. This is just the warmup, this little piece.”

    Full article, here. There’s also an audio version in case that’s your preferred consumption method. It’s about 40 minutes long if you do it that way (and don’t speed it up).

  • Below the surface

    Later this month the new 9.7 km North-South metro line in Amsterdam will start service. Like most large scale infrastructure projects, its opening has been delayed many times. 8 times according to this source. But this post is not about that. It’s about a byproduct of the line’s construction. 

    The excavations required for the line meant that two sections of the Amstel River – namely the Damrak and Rokin sites – had to be drained. This took place from 2003 to 2012 and gave archaeologists unprecedented access to the bottom of a river in the middle of a historic city center.

    Amsterdam started as a small trading port along the banks of the Amstel River some 800 years ago. So not surprisingly, they found a few things. Over 17,000 objects were found and all of them have been catalogued online according to time period, use, material, and location found.

    For the full catalogue of objects, click here. Screenshot of the catalogue shown above. And to learn more about the entire project, start here. There’s a lot of good stuff in there for city nerds.