Daily insights for city builders, delivered every morning at 6 AM ET. I’m Brandon Donnelly — a Toronto-based real estate developer and founder of Globizen. I’ve been writing here since 2013.

Tag: canada

  • Canada’s 1%

    The Globe and Mail recently published an article about Canada’s highest paid workers. It uses census data spanning 2005 to 2015.

    There’s a feature that allows you to enter your before tax income, your location, and your gender to see how you compare to “the 1 percent.”

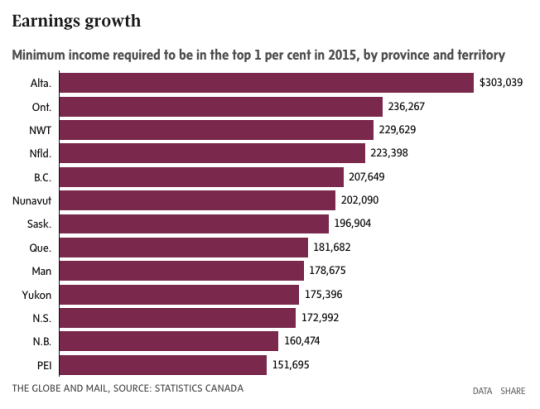
    But in case you don’t feel like doing that, here’s the minimum income required to be in the top 1 percent as of 2015 for each province/territory:

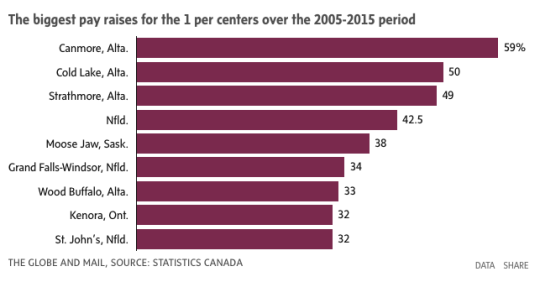
    And here are the communities where the 1% saw the biggest pay increases:

    The data certainly underscores how important commodities have been for growing individual incomes. Alberta, Newfoundland, and Saskatchewan are resource-rich provinces.

    However, the above data doesn’t capture the collapse of oil prices in 2014. So it would be important to also consider what this data looks like outside of a commodities boom.

    Charts: The Globe and Mail

  • Is Trump good for Canada?

    Richard Florida and Joshua Gans just published an article in Politico called: Trump Is Making Canada Great Again. The overarching argument is that as the US closes its borders, Canada benefits. The best and brightest from around the world are coming here.

    This fall, international student applications at the University of Toronto were up 70% compared to last year. And numerous companies in Toronto are reporting “steady, double-digit increases” in the number of job applications from Americans.

    This is exactly what I was getting at when I made the pithy prediction that Amazon is going to choose Toronto for HQ2. It’s about access to human capital (though I acknowledge the political reality of selecting a city outside of the US). 

    Perhaps here or here might work for a location.

    Here is an excerpt from the Politico article that starts to speak to the importance of foreign-born workers in the US:

    As of 2013, foreign-born workers in STEM fields—science, technology engineering and math—accounted for nearly a fifth of workers with bachelor’s degrees in the United States, 40 percent of those with master’s degrees and more than half of those with Ph.D.s. In the San Jose metro area, consisting largely of Silicon Valley, immigrants comprise more than 55 percent of adults who hold advanced degrees.

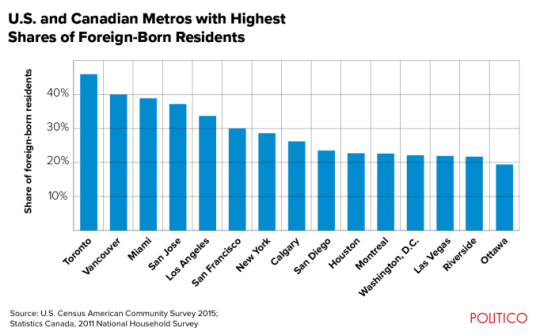
    Here is a chart showing the US and Canadian metros with the highest percentage of foreign-born residents:

    image

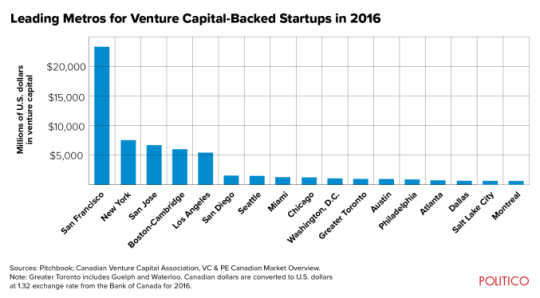
    And here is a chart showing which metro areas receive the most venture capital dollars (in millions of US dollars):

    image

    As to be expected, Toronto, Vancouver and Miami lead in terms of the percentage of foreign-born residents. Though, I would bet that Toronto’s foreign-born population is far more diverse than those of Vancouver and Miami.

    However, when you look at venture capital dollars invested, Toronto is nowhere near the top. Vancouver isn’t even on the list. And I suspect that some of you are surprised to see Miami sitting in between Chicago and Seattle (arguably a city that overperforms in tech relative to VC dollars invested). I was.

    Perhaps Trump will help with this by making Canada great again.

  • The 10 most promising Hyperloop routes (and thoughts on the naysayers)

    image

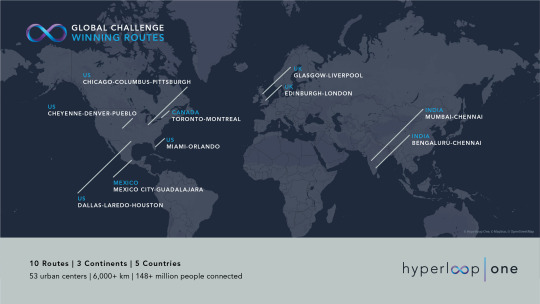
    On September 14, 2017, Hyperloop One announced the 10 winners of its Global Challenge. These are the world’s “most promising” Hyperloop routes; selected through a process that began in May 2016 and involved more than 2,600 registered teams.

    The winners:

    1. Canada | Toronto-Montreal
    2. India | Bengaluru-Chennai
    3. India | Mumbai-Chennai
    4. Mexico | Mexico City-Guadalajara
    5. UK | Edinburgh-London
    6. UK | Glasgow-Liverpool
    7. US | Chicago-Columbus-Pittsburgh
    8. US | Miami-Orlando
    9. US | Cheyenne-Denver-Pueblo
    10. US | Dallas-Laredo-Houston

    If you aren’t familiar with what Hyperloop One is trying to accomplish, here is a quick video explaining the basics. Their goal is to have the world’s first operating Hyperloop by 2021.

    If you happen to live in one of the above regions (about 148 million of us do), then you are probably already seeing the headlines in your feeds. For Canada, the promise is of connecting 25% of our country’s population with one single Hyperloop route.

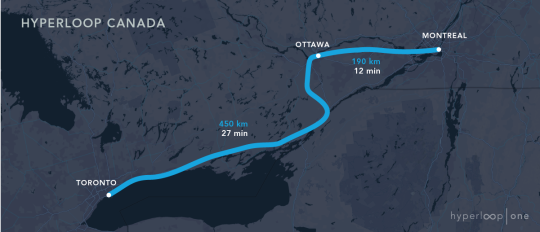
    It would mean Toronto-Montreal in just 39 minutes:

    image

    This is shorter than many morning commutes. So it’s not hard to see why this is a tantalizing proposition. It would mean a union of our two biggest cities and our capital. More accessible Montreal bagels. And maybe, just maybe, a strengthened sense of bilingualism in this country. 

    But there are also critics who believe that all of this Hyperloop hype is simply a distraction. Why not focus on proven technologies as opposed to some fanciful pipe dream that may never materialize? This is about stroking political egos as opposed to real progress.

    My views are pretty simple on this one.

    Will Hyperloop Canada happen? Maybe. Maybe not. I sure hope it does. But it may not. It’s easy to draw lines on a map. It’s much harder to actually execute on those lines. And of course, logistics aside, the technology is still being developed.

    But if all we ever focused our energy on were things that have already been “proven”, we likely wouldn’t create many new things. Things that today are proven, were once unproven. But they became proven because there were folks who didn’t let that minor detail deter them from trying. They went for it.

    So if a private company would like to go out and raise $160 million from private investors to try and figure out how to sustainably connect Canada’s two largest cities in 39 minutes, I am more than happy to cheerlead. Because I’m not the one trying. Who am I to naysay? 

  • Official bilingualism

    When I was around 8 or 9 years old my mother put me into a French school in Toronto. Her logic was simple: “This is Canada. You should know how to speak both official languages. It will create opportunities for you in the future.”

    But I hated it. I couldn’t speak a word of French at the time and so I would come home from school complaining that I couldn’t understand anything the teacher was saying. How was I supposed to learn anything? 

    I begged her to put me back into an English school.

    To her credit, my mother remained absolutely steadfast. She would say to me: “Trust me. You’re going to thank me for this later.”

    Not surprisingly, I learned French. I was put into a special “intro” stream and so when my classmates were off learning a third language (German), I was given introductory classes designed to bring me up to their French level.

    I still remember the sense of accomplishment I felt when I could finally carry on an actual conversation in French.

    Sadly, at this point in my life, my French is fairly rusty. I really should work on that. But it’s decent enough that people in Montréal – which is where I am right now – will say to me: “You’re from Toronto. How is it that you speak French?” 

    In fact, somebody said to me last night that in Montréal they typically encounter more French speakers from the U.S. than they do from Ontario. That surprised me. As a country, about 10 million Canadians report being able to speak French (2011 number).

    Every time I visit Montréal, I marvel at the display of bilingualism that seems omnipresent in this city. And, if you grew up in an immigrant household, you may also speak a third language – the one your parents spoke to you in. I think that’s wonderful.

    So with that: thanks mom.

  • Supply, not foreigners

    The chief economist at the Canada Mortgage and Housing Corporation (CMHC), Bob Dugan, recently published a piece in Macleans called: why the foreign buyers tax isn’t making Vancouver more affordable.

    Here’s an excerpt:

    One year after the implementation of the foreign buyers tax, monthly sales to foreign investors now hover around 4 per cent of all sales. But our latest Housing Market Assessment, released in July, still shows a red flag for Vancouver—with particular concern given to overvaluation and price acceleration. Average prices in Vancouver have rebounded to where they were before the tax’s implementation. In between, there was a marked drop, but it appears to have been temporary. In short, Vancouver is largely right back to where it was before the tax.

    He goes on to argue that while there are many factors affecting home prices, “supply is by far the chief factor.” This, of course, is a refrain you hear from everyone in the real estate business, so I’m not going to belabor the point.

    But I would like to point out some of the percentages. 

    Before the tax, foreign sales in Vancouver (to buyers who do not have a permanent address in Canada) were thought to sit at roughly 10%. Immediately following the tax, when everyone was trying to assess the impact, this dropped to ~0.9%. And now it’s back up to somewhere around 4%, according to the article.

    Arguably, there has been a slight reduction. Though who knows how accurate these percentages are. There is now a strong incentive to hide foreignness. 

    Regardless, CMHC doesn’t believe it’s working.

  • Our bias toward homeownership

    We have a cultural bias toward homeownership in this country. Other countries have it too. We believe that homeownership is what you should aspire to.

    In 2011, Statistics Canada pegged the homeownership rate at 69%. 9.2 million households out of a total of 13.3 million. Other more recent data suggests that it’s probably a bit lower, though still higher than that of the US since the financial crisis.

    Regardless, more owners than renters.

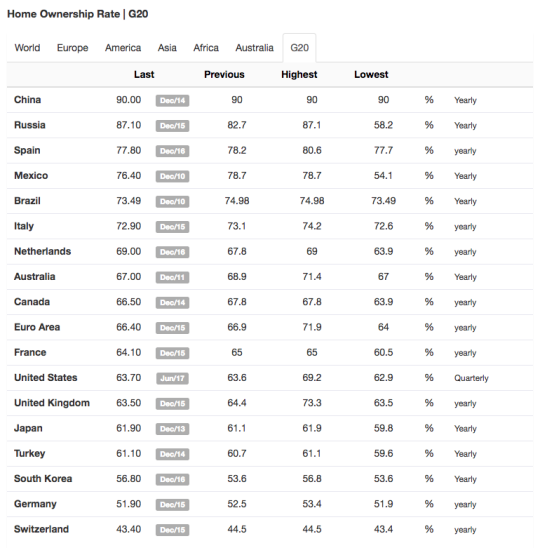
    I am not here to throw stones. I get it. I own my home. However, I do think it’s important to put this into perspective. Below is a chart from Trading Economics of homeownership rates in the G20:

    image

    At the bottom of the list – with the lowest homeownership rates – are Germany and Switzerland. Germany appears almost evenly split between owners and renters. And Switzerland is more renters than owners. 

    Both of these countries are wealthy. Both have a higher GDP per capita than that of Canada according to the World Bank and the International Monetary Fund. 

    Anecdotally, I can also say that some of the wealthiest people I know have made the decision to rent. They have simply decided to invest their capital elsewhere.

    I’m not trying to insinuate any sort of correlation with these statements, but I am trying to draw attention to a cultural bias.

  • Canada 150(ish)

    image

    Today is Canada Day. And I love my country. (If you’re reading this via email subscription, then: Yesterday was Canada Day.)

    I recognize that not everyone who reads this blog is Canadian. In fact, 50% of my email subscribers and 36% of the users who read this blog on the web are actually from the United States. More Americans subscribe to this blog than Canadians.

    But today isn’t your average Canada Day. It’s the sesquicentennial anniversary of Canadian Confederation. Canadians all across the country and world are and will be celebrating. 

    The CN Tower will put on a pyrotechnics show this evening at 10:30pm and I’ll be watching. There’s even the world’s largest rubber ducky bobbing around in Lake Ontario. I’m missing the connection on this one, but a 6 storey rubber ducky is definitely worthy of an Instagram post or two. Perhaps we should have gone all out and staged a complete bathtub scene in Toronto’s inner harbor. That would have been fun.

    But as much as 150 years of Canada sounds and feels great, I’d like to talk about a different moniker today: Canada 150(ish). And I have two reasons for saying this.

    One the most effective ways to explain the difference between Canada and the United States is to talk about how we became independent.

    In the U.S. it was a “decisive declaration” leading to war. Americans fought for their independence and July 4, 1776 has become a clear temporal marker. They were dependent before and independent after.

    In Canada, our day of independence is less decisive. Instead of complete autonomy, it marks the beginning of a long and gradual process of becoming less and less British, one which arguably didn’t fully conclude until the Canada Act of 1982

    So might we call today Canada 35?

    One could also argue that this process isn’t fully complete. I don’t know about you, but our lingering connections to Britain – however benign they may be – actually weaken the Canadian story for me.

    The second reason why I’m throwing out Canada 150(ish) is because I want to acknowledge the fact that there are people in this country who feel excluded from the solidarity that “Canada 150″ is trying to instil. Here is an excerpt from a New Yorker essay by Molly Worthen that was published early this morning:

    Of course, the story of Confederation is largely a story of white men who mostly spoke English. This summer, the few Canadians who are eager to talk about history and reexamine the details of their constitution are those who feel excluded from the standard narrative of Canadian unity and progress: indigenous people and Francophone Québécois.

    Now that I’ve gotten this off my chest, I’m going to get on with celebrating Canada 150 and this incredible place of democracy and opportunity. And for all of the Americans who read this blog, happy 4th of July.

    Photo by Harry Sandhu on Unsplash

  • Visualizing the origins of MIT’s international students

    “Like the United States, and thanks to the United States, MIT gains tremendous strength by being a magnet for talent from around the world. Faculty, students, post-docs and staff from 134 other nations join us here because they love our mission, our values and our community.” -L.Rafael Reif, MIT President

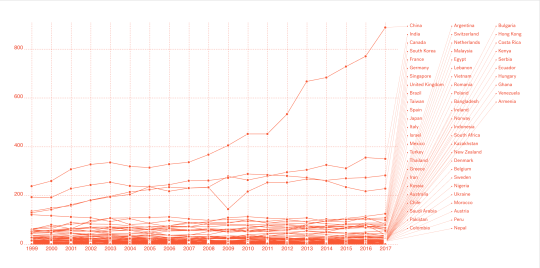
    The MIT Senseable City Lab recently analyzed nearly 20 years of ethnographic student data in order to visualize the origins of its international faculty, students, and researchers from 1999 to the present.

    The above chart may be a bit small (larger version here), but it shows all students (undergraduate, graduate, and visiting/others) by country. The top 5 countries are China, India, Canada, South Korea, and France.

    To give you some sense of the math, there are 3,808 international students at MIT as of 2017. 888 of them alone are from China – mostly at the graduate level (688 out of the 888). So China represents almost ¼ of MIT’s international student population.

    Another thing that stood out for me was the drop off in Canadians in 2009. You can see that “V” roughly in the middle of the chart. Canada went from 233 to 144 students. I wonder if this had something to do with the economic climate at the time. Not sure.

    Click here to see all of the visualizations. 

    Note that you can toggle by region and country, as well as by “Trump’s EO Countries.” That feature, as well as the quote at the beginning of this post, should give you an immediate appreciation for some of the motivations behind this exercise.

    Images: MIT Senseable City Lab

  • Top 10 city regions by GDP (and comparable countries)

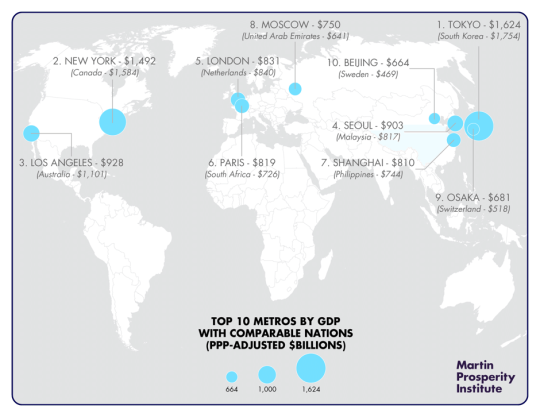
    Below is a mapping (by Taylor Blake of the Martin Prosperity Institute) of the top 10 metro economies in the world by GDP at purchasing power parity. In brackets, is a country with a comparable GDP.

    Tokyo is the world’s largest metro economy with ~$1.6 trillion in GDP. This is greater than the GDP of all of Canada. New York City is number 2 with ~$1.5 trillion in GDP, which is only slightly less than Canada.

    The point of all of this – which Richard Florida argues here – is that the global economy is, today, powered by metropolitan areas. And yet our governance structures do not reflect this new reality.

    Here’s an excerpt from Florida’s article:

    “Cities really are the new power centers of the global economy—the platforms for innovation, entrepreneurship, and economic growth. But when it comes to fiscal and political power, they remain beholden to increasingly anachronistic and backward-looking nation-states, which has become distressingly obvious with the rise of Trumpism in the United States and populism around the world.”

    Florida has been arguing this for years and I’ve really gotten behind it. The above chart is a good reminder just how big and wealthy some cities have become in today’s economy. 

  • Latest house-price indicators from The Economist

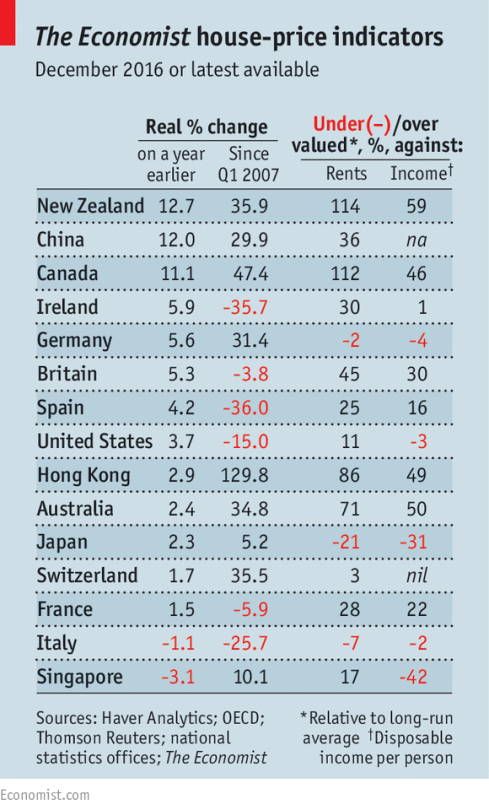
    The Economist recently published the following chart alongside this article talking about the impact of foreign buyers on global house prices.

    image

    They also have this set of interactive graphs that allows you to chart prices according to a number of different measures. The two metrics that The Economist focuses on (above) are house prices against rents and house prices against incomes. 

    The argument they make is that as (foreign) capital begins to think of property as merely a bolthole, it can start to detach itself from fundamentals such as rents and incomes. New Zealand, Canada, and Australia are specifically called out.

    This isn’t necessarily news. And one chart can only tell you so much. But I like staying on top of the various indices.