Daily insights for city builders, delivered every morning at 6 AM ET. I’m Brandon Donnelly — a Toronto-based real estate developer and founder of Globizen. I’ve been writing here since 2013.

Tag: big data

  • Tasty data

    A recent study and research paper by the MIT Senseable City Lab — called, Tasty Data — has discovered that restaurant data alone can be used to accurately predict location-based factors such as daytime population, nighttime population, number of businesses, and overall consumer spending within a specific geography.

    They started by pulling restaurant data from Dianping (Chinese equivalent of Yelp) for 9 Chinese cities: Baoding, Beijing, Chengdu, Hengyang, Kunming, Shenyang, Shenzen, Yueyang, and Zhengzhou. They then paired their Dianping data with other available data (such as aggregated mobile phone data) and used machine learning to search for any correlations.

    Below is a diagram of “nighttime population” in Beijing. They are using a 3 km2 grid.

    If you’re a regular reader of this blog, you’ll know that I like these kinds of studies. By 2020, it is estimated that 1.7MB of data will be created every second by every person on earth. The numbers are staggering. And yet, “official” data sources, such as census data, remain slow and fairly limited. Studies like this one continue to show us what’s next.

    Image: MIT Senseable City Lab
  • Our social connectedness

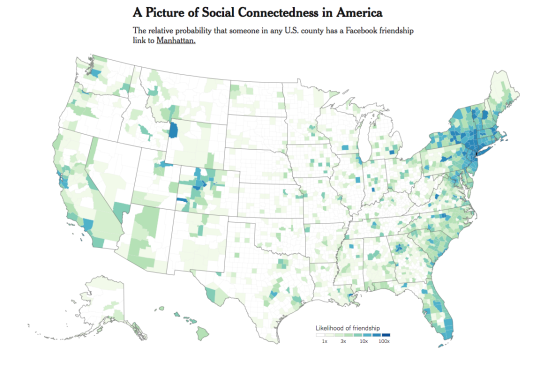
    Economists at Facebook, Harvard, Princeton and NYU recently analyzed anonymous Facebook data in order to study our social connectedness. The New York Times’ Upshot wrote about it here and it is a must read.

    There are a number of interesting takeaways from the study. One of them is that geography, distance, and political boundaries actually matter a great deal when it comes to our connectedness. 

    In other words, Americans are more like to be connected to someone nearby – within county or state boundaries – than they are to someone further away who may be infinitely more similar. This may seem somewhat intuitive.

    But at the same time, having a dispersed network also suggests certain things. Here’s the relationship that they discovered:

    These networks are important in part because of other patterns that are correlated with them. Counties with more dispersed networks — where a smaller share of Facebook friends are located nearby, or among the nearest 50 million people — are on average richer, more educated and have longer life expectancies. Places that are more closely connected to one another also have more migration, trade and patent citations between them.

    Counties that are more geographically isolated in the index are more likely to have lower labor force participation and economic mobility, and they have higher rates of teenage births. Some of the most economically distressed parts of the country appear to be the most disconnected: Among the 10 U.S. counties with the highest share of friends within 50 miles, six are in Kentucky.

    Again, it is worth checking out the full article. There’s also an interactive map to play around with.

  • Data is the new oil

    “A NEW commodity spawns a lucrative, fast-growing industry, prompting antitrust regulators to step in to restrain those who control its flow. A century ago, the resource in question was oil. Now similar concerns are being raised by the giants that deal in data, the oil of the digital era.“

    The Economist just penned an interesting piece arguing that the world’s most valuable resource is no longer oil, but data. That’s why the five most valuable publicly traded companies in the world are all tech/data companies.

    But the point they are really making is that current antitrust remedies are poorly suited to this new precious commodity. For example, in today’s world authorities need to be thinking not just about firm size, but about the extent of their data collection.

    There’s a reason firms with no (meaningful) revenue get acquired for huge numbers. Yes, sometimes it’s just for the talent. But it’s also because of the data they control and the potential threat they pose.

    So much of what we do today leaves a digital trace. And those traces are hugely valuable. I suspect we will be hearing more about this as the data economy continues to spawn tech giants.

  • What Facebook knows about you

    Here is an eye-opening article from data scientist Vicki Boykis outlining the number of ways in which Facebook collects data about its users. It’s called: What should you think about when using Facebook?

    One of the more surprising tidbits from Boykis’ article is that Facebook collects keystrokes. That means if you start typing a status update but never actually post it, that information is still fair game.

    Facebook previously used this data for a study on self-censorship. That sounds like like a fascinating study, but I’m sure the thought is also scaring many of you if you care about privacy.

    Here is a quote from the article that gets at the core of what is going on:

    “The fundamental purpose of most people at Facebook working on data is to influence and alter people’s moods and behaviour. They are doing it all the time to make you like stories more, to click on more ads, to spend more time on the site.”

    A worthwhile read. And in case you didn’t already know, if you go to Settings -> Download a copy of your Facebook data, you can get a pretty good dump of your activity, including every private message you’ve ever sent on the platform.

  • Turning data exhaust into gold

    Last year, social media company Foursquare predicted that Chipotle would see a ~30% drop in its Q1 2016 sales. It knew this because the geo-location data from people using its app (check-ins and passive visits) was also down. They had figured out the relationship between foot traffic and sales. I think I wrote about this in the first half of last of year.

    Not surprisingly, lots of companies – including those on Wall Street – are now starting to pay attention to data sets such as these. Matt Turck wrote a great blog post about it this morning, called: The New Gold Rush? Wall Street Wants your Data. Here’s an excerpt:

    That a social media company could be building a data asset of immense value to Wall Street is part of an accelerating trend known as “alternative data”. As just about everything in our lives is getting sensed and captured by technology, financial services firms have been turning their attention to startups, with the hope of mining their data to extract the type of gold nuggets that will enable them to beat the market.

    The opportunity is open to a wide range of startups.  Many tech companies these days generate an interesting “data exhaust” as a by-product of their core activity.  If your company offers a payment solution, you may have interesting data on what people buy. A mobile app may accumulate geo-location data on where people shop or how often they go to the movies.  A connected health device may know who gets sick when and where.  A commerce company may have data on trends and consumer preferences. A SaaS provider may know what corporations purchase, or how many employees they hire, in which region. And so on and so forth.

    We may be calling this alternative data right now, but it is almost certainly just a matter of time before it simply becomes: the data. 

    I like the term “data exhaust” that Matt uses, because it feels like it accurately captures what is going on right now. The new economy is producing a lot of byproduct. If you clean it up and package it in the right way, then you might be creating additional value. But if you don’t, then it’s probably just exhaust.

  • Uber Movement

    Uber just announced that it will be providing access to the (anonymized) traffic flow data generated from its over 2 billion rides. This new product is called Uber Movement and the goal is to help cities make better infrastructure decisions. Because indirectly, that also benefits them. 

    Here’s an excerpt from TechCrunch:

    “We don’t plan infrastructure, we don’t plan cities, we’re never going to do that,” explained Uber Product Manager Jordan Gilbertson in a briefing. Not controlling those aspects of Uber’s business means that it must do whatever possible to influence their improvement indirectly, which Movement can certainly help to do. More efficient transportation in a city in general means more efficient Uber service delivery, happier customers and better usage rates.

    You can request access to Uber Movement today. But the service will be made available first to city planners and policymakers, and then to the general public. I would be very curious to see what the data reveals for Toronto, as well as for other cities.

  • A location intelligence company

    I have written about Foursquare a number of times over the years (here and here) and I continue to be a regular user. I am intrigued by all of the location-based data that they collect through their apps. 

    Below is a recent Recode Decode (podcast) with Dennis Crowley (co-founder) and Jeff Glueck (CEO) of Foursquare. They are talking about what’s next for the company. If you can’t see it below, click here.

    https://art19.com/shows/recode-decode/episodes/aa400a60-ebc1-49bb-96b1-0d7aac7ca9e8/embed?theme=black

    Here’s a content sample from Recode:

    Today, Foursquare makes most of its money from selling that data to big companies, calling itself a “location intelligence company.” But as co-founder Dennis Crowley and CEO Jeff Glueck explained on the latest episode of Recode Decode, hosted by Kara Swisher, they haven’t stopped thinking about everyday users.

    “Imagine a friend is walking alongside you,” Crowley said. “Can we make a personality like that, that talks to you in that sense? It’s not 30 years out. We’re going to be playing with this stuff a year from now.”

    “I want to make that Scarlett Johansson that whispers in your ear, but it’s all about local places and local discovery,” he added. “I want to replicate the experience of walking through the city with a friend that knows the city inside and out, and I want to make that for millions of people.”

    I thought some of you might find this interesting.

  • #BuildHereNow — Crowdsourced city building

    image

    This week Strong Towns has been running a great social media campaign called #BuildHereNow

    The way it works is very simple. They asked people to get outside and take photos of vacant and/or underutilized properties in their town or city and post them to Twitter or Instagram using the hashtag #BuildHereNow. The goal was to start to identify properties that could “use a little love" and to encourage city builders who might need a little push to develop a particular property.

    I’m a big fan of crowdsourcing information and I love the idea of digitally annotating buildings and spaces. In this case, it’s about pulling together the desires of the community,

    Hashtags are a great way to quickly make something like this happen, but I would love to see a purpose-built tech platform do this in a more permanent way. Of course, it doesn’t just have to be about developing. Buildings are rich in information; hopefully so rich that a platform like this could survive.

    If you think about it, property titles are already a form of annotating real property. So this isn’t really a new idea. 

    But now technology allows us to harvest all kinds of other information – such as what people would like to see built. Imagine the possibilities if we became more effective at collecting, organizing, and leveraging this data at scale.

  • Housing completions in Toronto from 1996 to 2014

    Whenever I read studies that cite census data, I’m often left feeling like the data is out-of-date. 

    Five years – which is how often Canada conducts its national census – is a long time. Somebody could move to this country for school, complete a 4-year degree, and then leave, and we wouldn’t even pick it up in our data.

    Thankfully, we’ve at least reinstated the long-form census for next year. Here are the questions, if you’re curious.

    But all of this is a digression. 

    This morning I read through a housing report that the City of Toronto published in October of this year. It’s about housing trends. And I wanted to share the below chart that covers housing completions for the period of 1996 to 2014. Keep in mind that this is for the City of Toronto, and not the Greater Toronto Area.

    What it shows is that over this 18 year period, 78% of all housing completions in this city have been either low-rise or high-rise condominiums/apartments. The remaining 22% is a mix of detached and semi-detached houses and townhouses.

    However, this 22% is an average. 

    Detached and semi-detached housing completions declined from 22% in the 1996-2001 period to 10% a decade later. And row and townhouses declined from 16% to 6% during this same period.

    At the same time, “many” of the housing units in this 22% were actually replacing existing and older housing stock. That is, according to the report, many were “knock-downs” and rebuilds. In these cases, it means that the completions actually do not represent net new housing units. So in reality, the supply of new single-family housing is even lower than it appears in the chart above.

    When you look at all of this, it should come as no surprise to you that our current combination of low interest rates and low supply has been leading to huge price increases on the single-family side of the market.

    And it’s for this reason that I believe Toronto will eventually start to look towards allowing more low-rise intensification. Laneway housing, as one example, would represent virtually 100% new ground-related housing in already built up areas. Where else are we going to find that kind of housing opportunity?

    So in my view, it is a question of when, not if, this will happen.

  • Foursquare uses their global foot traffic data to accurately predict iPhone sales

    I am a fan and long time user of Foursquare – now known as both Foursquare and Swarm.

    Foursquare has struggled against competitors such as Yelp.com when it comes to local business recommendations. And I have less than 100 friends on my Swarm. It doesn’t seem to be that popular here in Toronto.

    But I’ve always loved the data collection aspect of Foursquare / Swarm. Even though most people don’t seem to care about that. When I check-in somewhere, such as the gym, it’ll tell me how many weeks in a row I’ve been there, whether it’s a new personal record, who else is nearby, and a host of other things.

    I’ve always felt like there was so much potential in all of the data it was collecting.

    Well the company is starting to make better use of that data. Recently they used their foot traffic data at Apple stores (I am assuming this goes beyond just check-in data) to predict the number of iPhones that Apple was going to sell globally following the launch of the 6s and 6s Plus.

    They predicted between 13 to 15 million handsets and it turns out they were right:

    This validates the accuracy of our prediction and while we’re proud of the result, we certainly aren’t surprised. Foursquare’s data is essentially the world’s biggest panel of foot traffic data — we have the best sense of the trends and patterns of the movement of people and their phones around the world.

    This is powerful stuff. If there were a way for me to be bullish on Foursquare beyond just writing this post, I would be.