Daily insights for city builders, delivered every morning at 6 AM ET. I’m Brandon Donnelly — a Toronto-based real estate developer and founder of Globizen. I’ve been writing here since 2013.

Tag: beijing

  • Hong Kong wants to be a digital asset hub

    Today, June 1, is an important day for crypto and Hong Kong. The city just lifted its crypto ban and is once again allowing retail trading.

    Now, there’s a lot of speculation about what this will ultimately mean for the city and for Asia, given that Beijing is a crypto hater (all crypto transactions have been banned in China since 2021).

    Some think that this could be a leading indicator for a softening Chinese position on crypto; while the cynics think that this reinstatement could be short lived given that Beijing remains a hater.

    Whatever the outcome, I think it is noteworthy that Hong Kong is trying to reestablish itself as a global hub for digital assets and that it believes crypto is here to stay.

    It is also a good reminder that, even though the herd has moved onto AI, there’s still important work happening beneath many of the mainstream headlines.

    My own conviction and activities around crypto haven’t changed over the last year, and so I’m happy to see cities like Hong Kong working to reassert themselves in this space.

  • Hong Kong to Singapore, quietly

    Here is an interesting article from the Financial Times talking about the quiet move of people and companies from Hong Kong to Singapore. I say quiet, because apparently Hong Kong-based companies are reluctant to overtly signal that they are setting up offices and moving some of their executives out of the city, in case that starts to upset people over in Beijing.

    But the real estate market in Singapore seems to be benefitting from some of these macro trends, as well from the city-state’s handling of the coronavirus. This is despite there being a 25% stamp duty tax on foreign property purchases (US nationals and a few others are exempt) and despite the fact that the economy shrank in the second quarter of this year by the largest percentage (13.2%) since independence in 1965.

    According to FT, there were 2,362 residential property transactions in the core central region of Singapore in the first 9 month of this year. This compares to 1,962 transactions for the same period last year. Of these total sales, 260 residential homes were sold to foreign nationals this year (~11%), compared to 316 last year (~16%). While this is obviously a decline, including a decline in the percentage sold to foreign nationals, it still feels pretty significant given that the borders were presumably closed, or largely closed, earlier this year.

    Apparently 75% of the above 260 homes were sold to buyers from either mainland China or Hong Kong. I don’t know how this percentage compares to last year. But the narrative out there right now is that it is up (along with office leasing by foreign companies) and that Singapore is a pretty safe place to put your money right now.

    Photo by Kirill Petropavlov on Unsplash

  • China is building two new hospitals in response to virus — should only take a few weeks

    This morning I got caught up on what’s happening with the coronavirus that emerged in Wuhan, China, but that is now spreading quickly across mainland China. It’s unsettling. As of Saturday, there were over 1,287 confirmed cases in mainland China and 41 deaths. Right now, the belief is that the virus emerged from a seafood and meat market in Wuhan.

    The Wuhan virus belongs to a family of viruses known as coronaviruses, which includes the severe acute respiratory syndrome (SARS) that broke out in 2003 and killed 44 people in Canada alone. Typically, these viruses have jumped from animals (such as bats and pigs) to humans. The WSJ has a good summary of what is currently known about this coronavirus strain.

    All of this has overwhelmed hospitals in Wuhan and the videos accounts are heartbreaking to watch. The government has responded by vowing to build two new hospitals in order to fight the outbreak. But get this: the projected completion times are 10 and 15 days, respectively. The second hospital, to be called Leishenshan Hospital, is expected to house about 1,300 beds.

    I can’t even get a government signature on a single legal document within 10 to 15 days, and so it’s unfathomable to imagine building an entire hospital within that same period of time. Some of the media is calling this “infrastructure propaganda.” i.e. Look over here at all we’re doing for you. But there’s clearly a need and, if ever there was a time to move with a sense of urgency, now would be it.

    Photo by 海超 刘 on Unsplash

  • Tasty data

    A recent study and research paper by the MIT Senseable City Lab — called, Tasty Data — has discovered that restaurant data alone can be used to accurately predict location-based factors such as daytime population, nighttime population, number of businesses, and overall consumer spending within a specific geography.

    They started by pulling restaurant data from Dianping (Chinese equivalent of Yelp) for 9 Chinese cities: Baoding, Beijing, Chengdu, Hengyang, Kunming, Shenyang, Shenzen, Yueyang, and Zhengzhou. They then paired their Dianping data with other available data (such as aggregated mobile phone data) and used machine learning to search for any correlations.

    Below is a diagram of “nighttime population” in Beijing. They are using a 3 km2 grid.

    If you’re a regular reader of this blog, you’ll know that I like these kinds of studies. By 2020, it is estimated that 1.7MB of data will be created every second by every person on earth. The numbers are staggering. And yet, “official” data sources, such as census data, remain slow and fairly limited. Studies like this one continue to show us what’s next.

    Image: MIT Senseable City Lab

  • The scale and scope of urban tech

    “Cities have become the basic platforms for global innovation and economic growth, supplanting the corporation as the fundamental organizing unit of the contemporary economy.” -Richard Florida

    Richard Florida and Patrick Adler of the Martin Prosperity Institute here in Toronto have been doing some research on what they are calling “urban tech.” They define it as encompassing the following industry sectors: co-living and co-working; mobility; delivery; smart cities; construction tech; and real estate tech.

    Here are the largest urban tech startups based on the amount of VC investment they have received:

    Below is how the space breaks down by sector. Mobility / ride hailing is the behemoth, receiving 61% of all VC investment. Food delivery is next. And “proptech” is at the bottom.

    Finally, here are the top “urban tech” cities. Beijing is right up there with San Francisco.

    For more information on the study, click here.

    Tables: CityLab

  • Cumulative electric vehicle sales around the world

    When I was shopping for a new car last year I gave serious thought to buying an electric vehicle. In fact, it is what I initially set out to do. But I couldn’t find a model that I liked and I didn’t feel like the charging infrastructure was in place for me to go on snowboarding trips to places like Quebec or Vermont. So I went with an ICE vehicle. But we all know it is only a matter of time before we hit that tipping point, which is why 100% of the parking spots at our Junction House project will be ready for an electric vehicle charging station.

    According to a recent briefing from the International Council on Clean Transportation (ICCT), there were 3.1 million electric passenger vehicles in use around the world at the end of 2017. Almost all of them (98%) were located in China, Europe, Japan, and the United States, and nearly half of them (44%) were located in just 25 cities. Shanghai leads the world (or at least it did at the end of 2017) with 162,000 cumulative sales since 2011. This represents 5% of all global electric vehicle sales during this time period.

    The footnote to this is that most of Shanghai’s electric vehicles are actually plug-in hybrid electric vehicles, whereas in the case of Beijing — which is second only to Shanghai in terms of cumulative sales — it is virtually all battery electric vehicles. Digging even deeper, if you look at the share of electric vehicles sales in each city, it becomes clear that, on a per capita basis, the real leader is actually Norway. Between 40-50% of all cars sold in Oslo and Bergen were electric in 2017.

    Here is a chart from the ICCT:

    What is clear from these leading cities is that there are supportive policies and incentives in place to accelerate the adoption of electric vehicles. The chicken-and-egg dilemma, which is what I ran into, is that you really need the installed charging capacity. The ICCT estimates that the top 25 electric vehicle markets have about 24x the available charging per capita compared to other cities. That certainly helps.

  • The top 30 cities for tech and startup companies

    The third edition of Savills’ annual Tech Cities report is now out. Savills is a global real estate company headquartered in London and a few years ago they started looking and what makes a successful “tech city.” As always, you should take these rankings with a healthy dose of scepticism. But this one is based on over 100 individual metrics across 6 main categories:

    • Business environment (such as the size of the financial services industry)
    • Tech environment (such as the amount of inward VC investment)
    • City buzz and wellness (is it a cool place to live?)
    • Talent Pool (is the city creating and attracting young/smart talent?)
    • Real estate costs
    • Urban mobility

    Here are the top 30 cities for tech and startup companies:

    New York takes the top spot, supposedly because of its deep talent pool and position as one of if not the capital the world. But my friends in the Bay Area tell me that their housing shortage is also starting to impact SF’s tech dominance.

    Generally, the report finds that the above “tech cities” should see their GDP rise by 36% over the next decade, compared to 19% for other developed cities. I’m not sure how much of this has to do with tech, but the above list does differ from what you’d see in a more conventional global cities index. Here you have Austin ahead of global cities such as Hong Kong. And you have Toronto ahead of cities like Tokyo and Paris.

    One takeaway that shouldn’t come as a surprise to readers of this blog is the rise of Chinese cities in the index. Beijing is ahead of New York, London, and San Francisco by a wide margin in terms of annual VC investment. And Chinese cities as a whole are starting to take a greater share of global VC dollars (second chart below).

    If you’d like to download a PDF of the full report, you can do that here.

    Image: Photo by Jason Briscoe on Unsplash

  • Largest airport in the world

    I just finished scrolling through these photos (from the Atlantic) of Beijing Daxing International Airport, which is currently under construction about 46 kilometers south of Tiananmen Square. The first phase is expected to open in the second half of this year. It will be about 7.5 million square feet and be capable of handling some 72 million passengers per year (100 million at full build out). 

    Supposedly all of this will make it the largest airport in the world, which is pretty impressive considering Beijing Capital International Airport is already one of the busiest in the world. It too moves around 100 million passengers a year and is likely to overtake Hartsfield-Jackson Atlanta in the near term (if it hasn’t already).

    But in addition to being the biggest and baddest, two other things stand out to me about the design of Beijing Daxing. 

    The first is its starfish design. This was done to minimize the amount of walking between security and gate. Check-ins happen in the middle of the starfish and then the most you’ll ever have to walk is 600m (to end of one of the limbs). That’s in line with what most people would consider a reasonable urban transit radius.

    The second is the fact that the check-in area provides an aerial view of the gates below. You can see this layering in the photos from the Atlantic. This was done to create a visual connection between passengers and their family and friends. Usually, the goodbye waves happen at or before security. Here you get a bit more time. (Will security be an issue?)

    For the full set of photos from the Atlantic, click here. I have a thing for airports, so I thought this was a great set.

    Image: Wang Mingzhu via the Atlantic 

  • Tallest buildings completed in 2018

    image

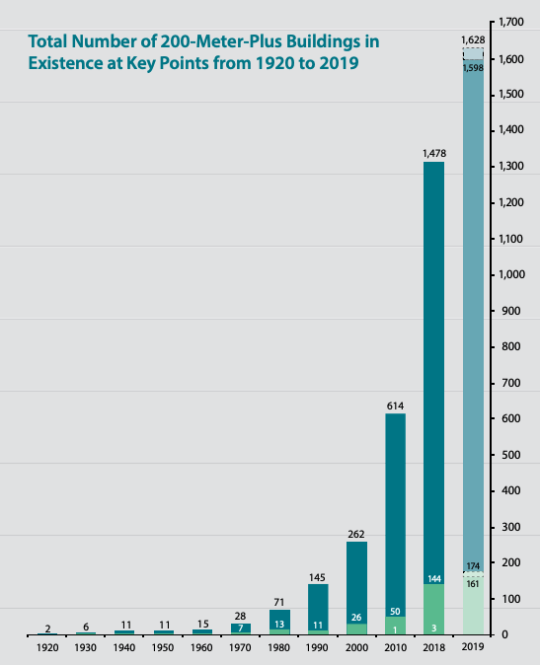
    The Council on Tall Buildings and Urban Habitat (CTBUH) recently published their annual study looking at all of the 200+ meter tall buildings completed over the last year.

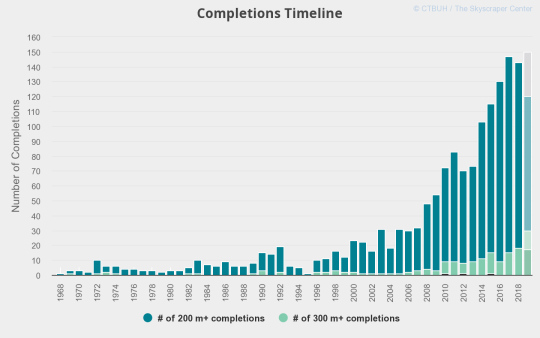
    143 were completed around the world. The all-time record was 147, which was in 2017. Last year, 18 “supertalls” were also completed. A supertall building is generally defined as having a height of 300m or more.

    The tallest building completed in 2018 was China Zun in Beijing. Pictured above. It is 527.7m tall (to tip), but the occupied height is 513.5m. 

    It was designed by Kohn Pedersen Fox Associates and looks like a Chinese finger trap. All iconic buildings deserve an endearing nickname, right?

    Below are a few interesting charts from the report. The first is the total number of tall buildings over 200m from 1920 to 2019. At whatever point they chose in the 1920s, there were only 2. Things sure changed starting in the 1980s.

    image

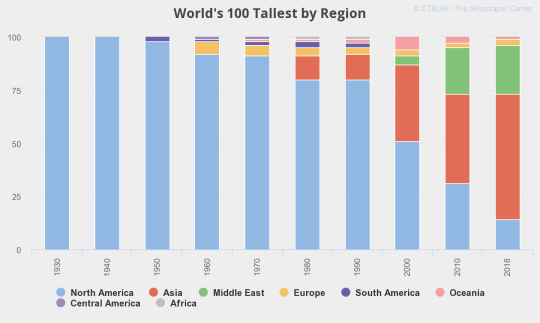
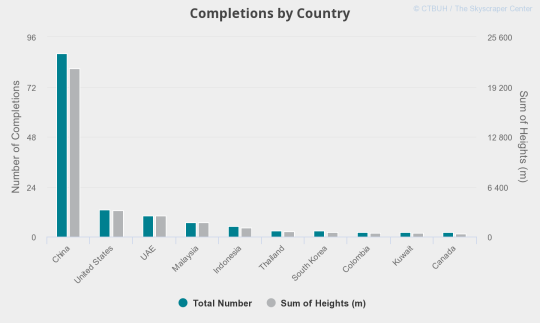
    That exponential growth happens to coincide with tall building growth in Asia and in particular China. The next few charts show (1) the handover from North America to Asia; (2) completions per year (broken down by talls and supertalls); and (3) completions by China, I mean country, last year.

    imageimageimage

    The full 2018 year in review report can be found here.

    Image: CTBUH

  • Multi-Unit Housing in Urban Cities: From 1800 to Present Day

    I just ordered a copy of Multi-Unit Housing in Urban Cities: From 1800 to Present Day by Katy Chey. I figured this was a book that we should have hanging around our office. I also like to support the Daniels Faculty.

    The book covers the following multi-unit housing typologies:

    • Back-to-backs in Birmingham
    • Tenements in London
    • Haussmann apartments in Paris
    • Tenements in New York
    • Tong lau in Hong Kong
    • Perimeter block, linear block and block-edge in Berlin
    • Perimeter block and solitaire in Amsterdam
    • Space-enclosing structures in Beijing
    • Kyosho jutaku in Tokyo
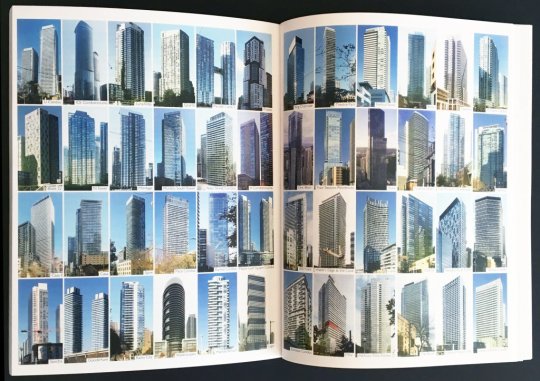
    • High-rises in Toronto

    In addition to each typology, the book analyzes the connection between the housing type and the city. Why did certain typologies flourish where they did and how have they helped to define their city?

    It reminds me of what I was trying to do with some of my recent posts about Hong Kong’s typical tower plan, albeit with far less rigor than what I am sure has been applied to this book.

    I am also curious to read what has been written about high-rises in Toronto. It goes to show you just how defining the current real estate cycle has been for this city. That’s our multi-unit housing typology.

    Image: Daniels Faculty. My multi-unit home made the book.