Daily insights for city builders, delivered every morning at 6 AM ET. I’m Brandon Donnelly — a Toronto-based real estate developer and founder of Globizen. I’ve been writing here since 2013.

Tag: athiscity

  • The value of a millisecond

    I’m reading a book right now called Flash Boys: A Wall Street Revolt

    One of my graduate school buddies recommended it to me on one of our annual ski/snowboard trips and I’m finally getting around to reading it. I’m only about half way through it, but I’m enjoying it so much that I have decided to write about it today.

    One of the protagonists in the book is a Toronto-native by the name of Brad Katsuyama. That’s probably one of the reasons I like it – although Michael Lewis makes all Canadians out to be overly polite and well-behaved. Is that what we’re like?

    The other reason I like the book is that a lot of it actually has to do with geography. Technology and the internet were supposed to make cities and location irrelevant. But as Flash Boys argues, location and physical connectivity matter a great deal in the world of high-frequency trading. Each millisecond matters.

    To illustrate this point, the book starts by describing the construction of a $300 million, 827-mile cable running as straight as humanly possible from Chicago to New Jersey in order to reduce data travel times from 17 to 13 milliseconds. That’s how much the milliseconds matter.

    This is also not a topic that I know a lot about and so it’s eye opening (and a bit disappointing) to learn about the sorts of things that happen in our financial markets. If any of you would like to borrow the book after I’m done (and are located in Toronto), leave me a comment below.
  • Developer Profile: The Adir Group

    In 2010, Gal and Tania Adir, aged 23 and 24, respectively, began renovating high-value apartments in central London.

    Today, they are known as The Adir Group and have about £50m in development under way.

    But more than just a developer, the group has grown to become “the parent company of a quickly expanding collection of complementary brands bound together by a desire to enhance people’s lifestyle through quality and beauty.”

    In addition to G&T (their residential development arm), they also founded Net.Works (a co-working space) and Nuper (a co-op living scheme). This last focus isn’t up on their website yet, but I read about it on Michael Mortensen’s blog. The goal of Nuper is to create affordable living solutions for young talent in London.

    I wanted to profile The Adir Group because I think it’s incredible how young they were when they got started (I was just starting graduate school at 23) and because I like their approach of creating a collection of complementary companies.

    I am excited to see where the next generation of developers (myself included) take this business. Already we are seeing some new approaches emerge.

  • A new era of (digital) globalization

    McKinsey recently published a report called Digital globalization: The new era of global flows.

    The overarching thesis is that we are transitioning to a data-driven global economy:

    “Flows of physical goods and finance were the hallmarks of the 20th-century global economy, but today those flows have flattened or declined. Twenty-first-century globalization is increasingly defined by flows of data and information. This phenomenon now underpins virtually all cross-border transactions within traditional flows while simultaneously transmitting a valuable stream of ideas and innovation around the world.”

    One of the benefits of this shift is that it has become easier for emerging economies and individuals from all around the world to participate.

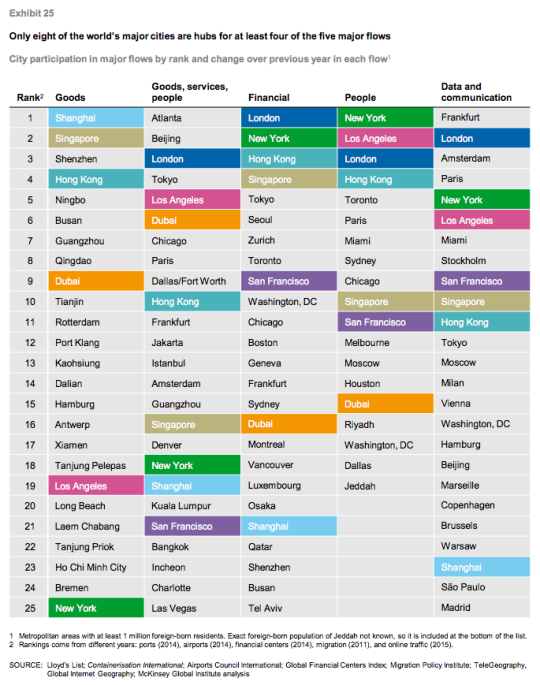
    Of course, not all countries and cities are participating equally. In their report, McKinsey ranks the top cities according to five global flows. In each case a proxy was used:

    “Unfortunately, data on global flows are not available at the city level. However, we have obtained data that serve as proxies for each of our five global flows. Container port volumes approximate goods flows; airport passenger volumes serve as a proxy for goods, service, and people flows; the ranking of cities in the Global Financial Centers Index by the Z/Yen Group provides an indication of financial flows; the number of foreign-born residents in a city measures people flows; and Internet bandwidth approximates data flows.” 

    Using this methodology, they believe that the world only has 8 truly global cities right now: New York, Los Angeles, San Francisco, London, Singapore, Shanghai, Hong Kong, and Dubai. They are the colored cities listed below:

    I always take these city rankings with a grain of salt. This stuff is not easy to quantify and a lot depends on the methodology that you use. 

    For instance, Atlanta sits on the top of “goods, services, and people” because it has the busiest airport in the world according to passenger volume. (It’s the primary hub of Delta Air Lines.) But is that enough to assert that Atlanta is #1? Maybe. Maybe not.

    In any case, the report is packed full of information. If you’d like to take a look, click here.

  • Urban jungle

    Keeping with yesterday’s theme of urban density, here is a photo by Andy Yeung that I am embedding via his 500px page:

    Urban Jungle #04 by Andy Yeung on 500px.com

    https://500px.com/embed.js

    The photo is of Hong Kong and it was taken using a drone. Click here for other photos from his “Urban Jungle” drone series.

    If you remember the maps from yesterday, you might remember that Hong Kong had a peak residential density of around 111,100 people per square kilometre (2013).

    Above is what that generally looks like.

  • Residential population densities compared

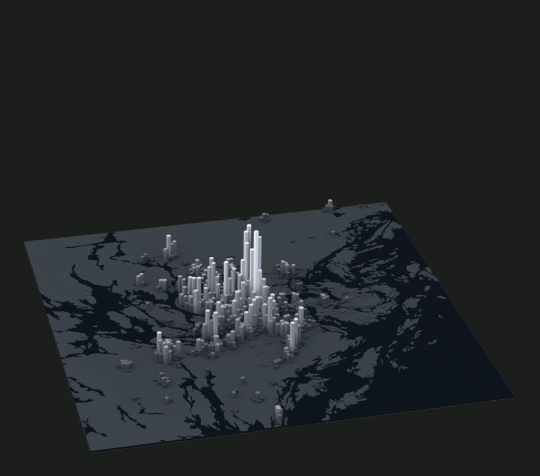
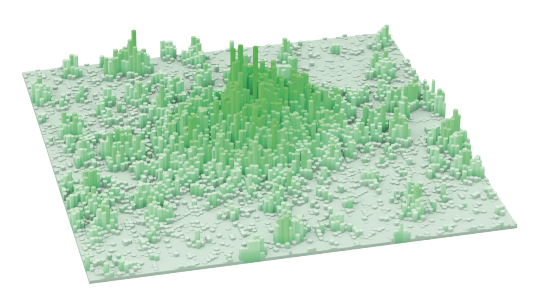
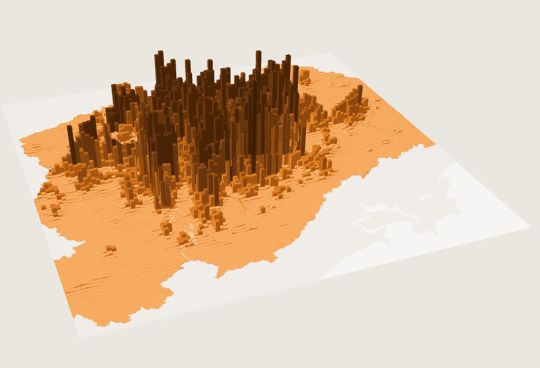
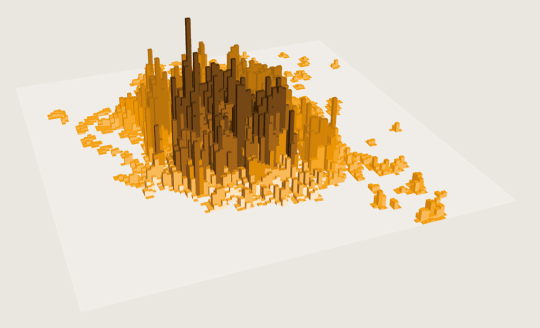
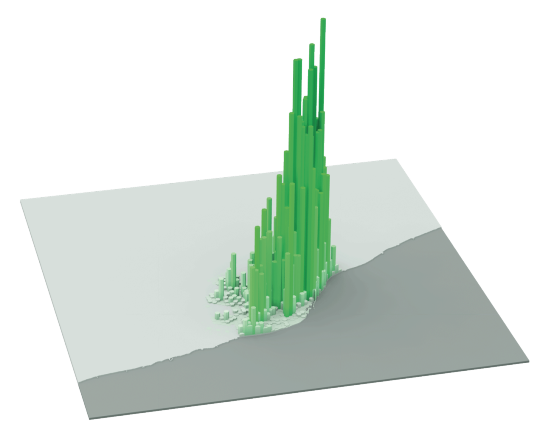
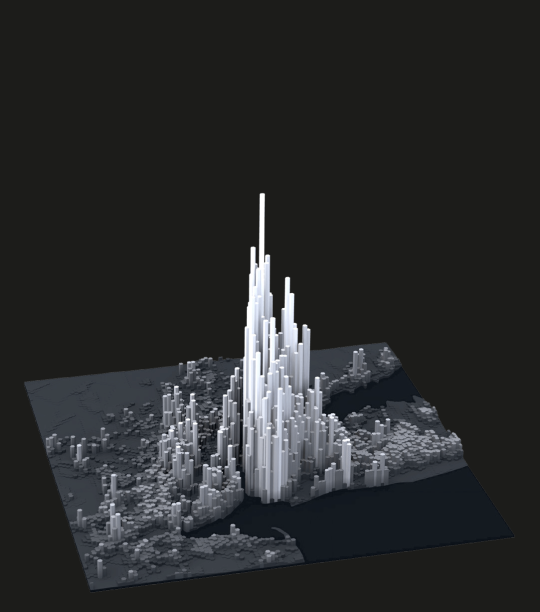
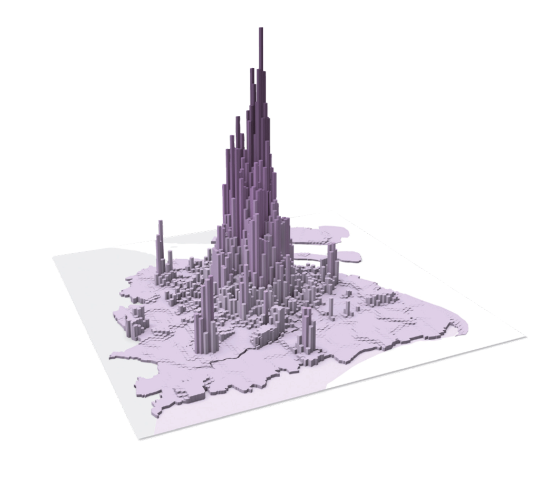
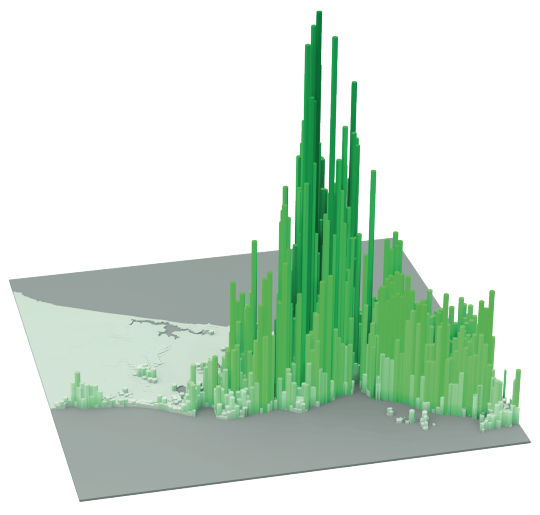
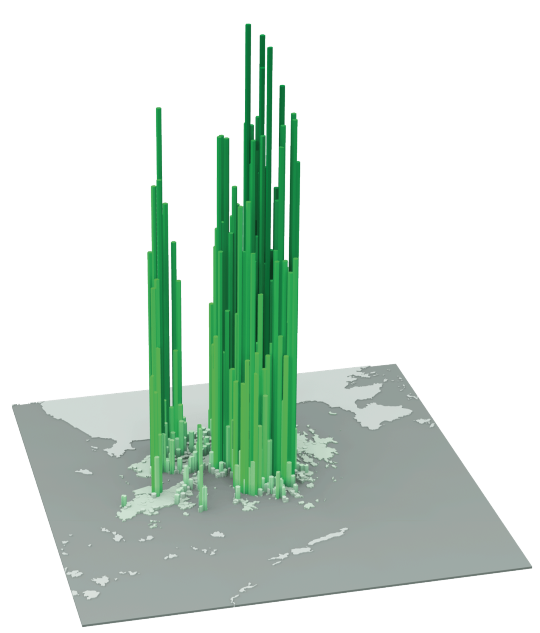
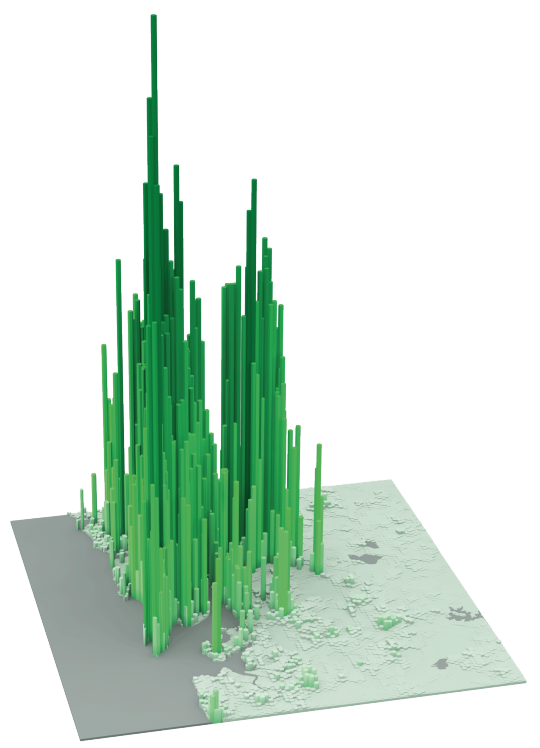
    The following diagrams were taken from LSE’s Urban Age website. I’ve sorted them from lowest to highest peak residential population density. In each case I’ve also included the year of the dataset. 

    It’s amazing how much these simple extrusion diagrams can tell you about the city. It also shows you that high population densities don’t necessarily need to equate to tall buildings. Barcelona, in particular, stands out for me.

    Berlin (Peak residential density: 21,700 people/km2, 2009)

    image

    Stockholm (Peak residential density: 24,900 people/km2, 2012)

    image

    London (Peak residential density: 27,100 people/km2, 2013)

    image

    São Paulo (Peak residential density: 29,380 people/km2, 2009)

    image

    Mexico City (Peak residential density: 48,300 people/km2, 2009)

    image

    Barcelona (Peak residential density: 56,800 people/km2, 2013)

    image

    New York (Peak residential density: 59,150 people/km2, 2012)

    image

    Shanghai (Peak residential density: 74,370 people/km2, 2011)

    image

    Istanbul (Peak residential density: 77,300 people/km2, 2013)

    image

    Hong Kong (Peak residential density: 111,100 people/km2, 2013)

    image

    Mumbai (Peak residential density: 121,300 people/km2, 2013)

    image

  • School of Real Estate

    I’ve been getting a lot of (email) questions lately about what to study in order to become a real estate developer. So I thought I would reblog this post that talks about exactly that. I wrote it over a year ago and I almost forgot it existed.

    At the same time, I’m reminded of something: I think these questions really speak to the fact that there’s a significant opportunity (particularly in Canada) in terms of real estate development education. 

    Oftentimes when I get these questions, I end up recommending the Master of Science in Real Estate Development (MSRED) at ColumbiaMIT, and USC. Why don’t we have something similar (and better) in Canada? We are falling behind.

    I have raised this with some Universities here in Toronto, but the response I got was that they felt the real estate courses being offered as part of their existing MBA programs were more than sufficient. I think we can do a lot better.

    One professor suggested that I line up a big donor and work with them to spearhead the creation of the (Insert Donor Name Here) School of Real Estate. I think that’s a great idea, but not something I have the capacity for right now.

    Hopefully somebody else out there is of the same mind.

    Post Update: 3 days ago the Schulich School of Business (York University) announced a one-year full time Master of Real Estate and Infrastructure (MREI) program – the first of its kind in Canada. 

    This is great news. 

    Now I would love to see the University of Toronto and Ryerson University (as well as others) step up and leverage their respective architecture schools. Schulich is already out of the gate on this one.

  • Global home prices at the end of 2015

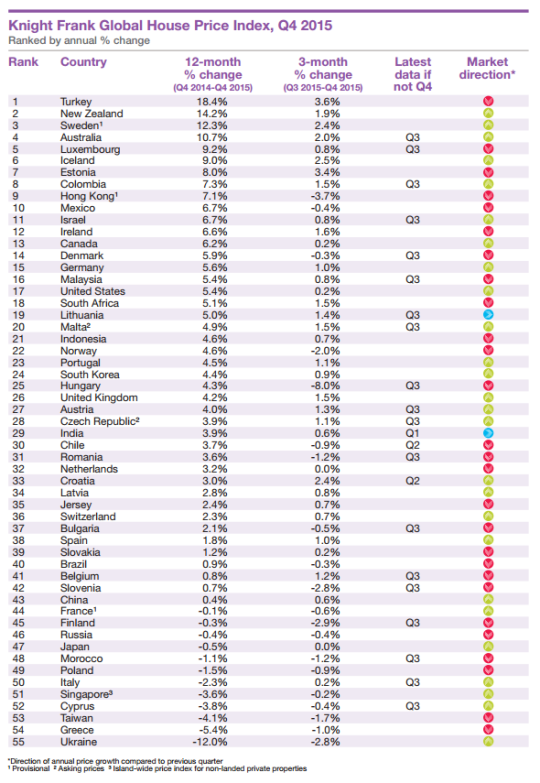
    Seeing how we’ve started looking at data from last year, I thought it would be interesting to look at global home prices as of Q4 2015. Here’s a chart from Knight Frank, which they refer to as their Global House Price Index:

    At the top of the list is Turkey, with an 18.4% increase from Q4 2014 to Q4 2015. (Supposedly this is because it has recently become easier for foreigners to buy property in the country.) Canada is 13th with a 6.2% increase (during this same time period) and the United States is 17th at 5.4%.

    This is obviously a high level analysis. There are lots of regional and local variations within each country. For instance in Canada right now, Calgary is a very different place than, say, Vancouver or Toronto.

    Nonetheless, it’s still valuable to see the relative performance of each country and see what their (Knight Frank’s) prediction is for 2016:

    “Our outlook for 2016 is muted. We expect the index’s overall rate of growth to be weaker in 2016 than 2015. The global economy is experiencing a potentially dangerous cocktail of low oil prices, a strong [US] dollar and a continued slowdown in China.”

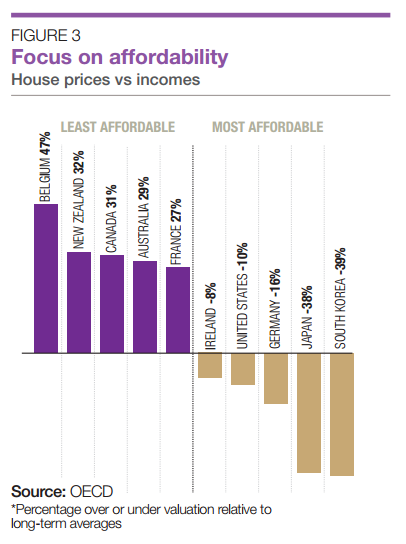
    It’s also interesting to see how the countries rank in terms of affordability:

    Once again, Canada ranks as being one of the least affordable countries in terms of home prices.

  • We’re driving again

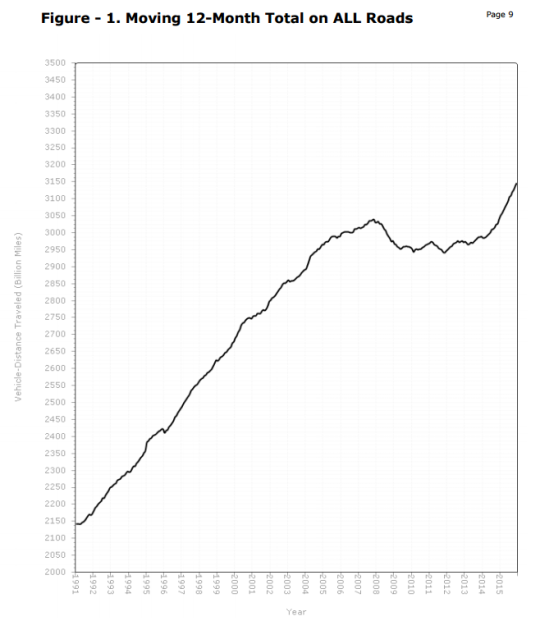
    For a number of years now, urbanists – including myself – have been thinking about “peak car.” And that’s because if you looked at vehicle miles traveled (VMT) in the United States since about 2007, the trend line was more or less flat. 

    This had us wondering whether or it was simply an outcome of the recession or some sort of broader shift.

    Well, if you look at the December 2015 numbers from the U.S. Department of Transportation, VMTs are once again growing. In fact, it’s now above the 2007 “peak.” Compared to December 2014, travel on all roads and streets in December 2015 was up by 4.2% or 10.6 billion vehicle miles traveled. 

    Here’s the chart:

    A lot of this could be because of lower gas prices. But I would be curious to hear your thoughts in the comments about whether or not you think 2007 to 2014 was (1) a recessionary blip or (2) a longer term trend in the making.

  • Getting distribution and how that is changing

    Aaron M. Renn recently published an article in The Washington Post talking about carless cities and driverless cars. It’s an interesting read, but I’m not going to talk about those topics today. So if that’s what you’re looking for, you’ll have to read his piece.

    I do, however, want to focus on one particular aspect of it. 

    In it, he talks about how Tesla is shifting the “locus of power in the auto industry” from Detroit to Silicon Valley and, at the same time, changing the way cars are sold. Tesla sells direct to consumers through its corporate stores, whereas franchise laws in almost every U.S. state mandate that new cars need to be sold through dealers.

    I’m not sure how these laws came to be, but it’s interesting to note yet another example of technology and the internet sparking disintermediation. That is, the removal of middle people, distributors, brokers, and so on. It’s the same thing that is happening as a result of companies like Uber and technologies like Bitcoin.

    I would imagine that lot of these legacy distribution models exist today because it was previously the most efficient option. If you were a car company based in Detroit, a network of local franchisees all across the country working to sell your cars was probably a great thing. But now there are other options, as is the case with many other industries.

    So what’s next? 

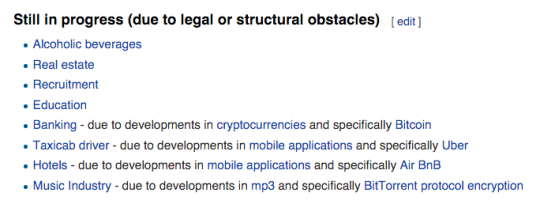
    Wikipedia calls out the following industries as still being in the midst of disintermediation:

    I bet you all know which one I’m watching closely.

  • VIA 57WEST in New York starts renting apartments

    image

    Bjarke Ingels’ West 57th Street project in New York (developed by The Durst Organization) has just started renting apartments (March 1). 

    Since I’m in the rental business, I thought it would be worthwhile to take a look at the rents – though I tend to obsess over all buildings and not just rental ones.

    Firstly, the project has a total of 709 apartments and 178 different unit types because of the architectural variations in the building. Of these units, 142 of them (20%) have been designated as affordable and were offered up via a lottery to people who fall within certain incomes ranges. 

    Here are the affordable rents via 6sqft.com:

    image

    I don’t know the exact numbers, but Curbed New York speculated – based on what was seen at other buildings on the west side – that the total number of applicants for these 142 units may have reached over 100,000!

    For the market-rate units, the average monthly rents are as follows (via Curbed NY):

    • Studio: $2,770
    • One-bedroom: $3,880
    • Two-bedroom: $6,500
    • Three-bedroom: $11,000
    • Four-bedroom: $16,500

    I wasn’t able to find average unit sizes (to calculate per square foot rents), but I estimate the overall average unit size to be around 1,000 square feet. 

    940,000 sf (total gross floor area)45,000 sf of retail x 0.80 efficiency (lower than average because of the shape of the building) / 709 units = approximately 1,000 sf of rentable area per unit. That’s just my rough guess based on what I could find online.

    Based on the Curbed comment section though, there are certainly some smaller units:

    image

    If anyone has any additional figures, please share them in the comments below. I think there are a few subscribers to this blog who are involved in the project.

    Image from via57west.com