Daily insights for city builders, delivered every morning at 6 AM ET. I’m Brandon Donnelly — a Toronto-based real estate developer and founder of Globizen. I’ve been writing here since 2013.

  • What’s in a sign?

    The built environment is the environment that we create around ourselves. Signs are a part of that.

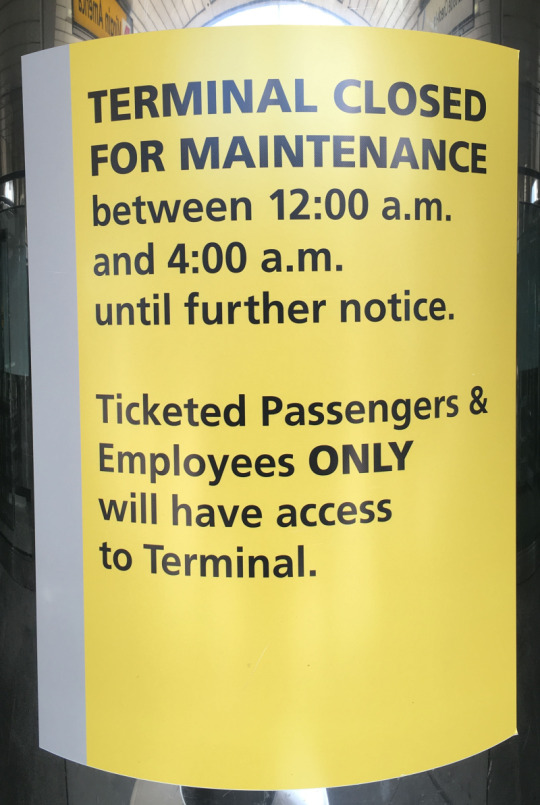
    Seth Godin recently posted this sign on his blog:

    It was seen at LaGuardia Airport.

    He then asked a few pertinent questions, dissecting the signs intent. Finally, he suggested the following reword:

    Hi. To keep this terminal clean, it’s closed to visitors from midnight until 4 a.m. every night. Ticketed passengers are always welcome.

    Which one do you prefer?

    Which one is clearer?

    Which one speaks to you with empathy?

    Dan Pink would call the reword: emotionally intelligent signage.

  • Sixth facade

    A new treehouse at the Treehotel in northern Sweden just opened up this week. (Their website wasn’t working at the time of writing this post.) 

    It was designed by the Oslo and New York-based Snøhetta. All 6 of the cabins at the Treehotel were designed by Scandinavian architects.

    The treehouse is clad in charred-timber (on trend right now) and is raised 10m (~3 storeys) up into the air to provide views out to the landscape. The underside of the treehouse, which is visible as you walk up its stairs, is finished with a black and white image of a forest. According to Dezeen, the architect calls it the sixth facade.

    Below is what that looks like. (Photo by Johan Jansson via designboom.)

    The net you (hopefully) see in the middle of the treehouse is so that you can sleep outside and stare up at the aurora borealis. The treehouse itself is 55 square meters (almost 600 square feet) and is designed to accommodate 5 guests. It has 2 bedrooms. I guess the 5th person has to sleep outside on the net terrace.

    Seeing this project has me excited to be back in the mountains next month.

  • Turning data exhaust into gold

    Last year, social media company Foursquare predicted that Chipotle would see a ~30% drop in its Q1 2016 sales. It knew this because the geo-location data from people using its app (check-ins and passive visits) was also down. They had figured out the relationship between foot traffic and sales. I think I wrote about this in the first half of last of year.

    Not surprisingly, lots of companies – including those on Wall Street – are now starting to pay attention to data sets such as these. Matt Turck wrote a great blog post about it this morning, called: The New Gold Rush? Wall Street Wants your Data. Here’s an excerpt:

    That a social media company could be building a data asset of immense value to Wall Street is part of an accelerating trend known as “alternative data”. As just about everything in our lives is getting sensed and captured by technology, financial services firms have been turning their attention to startups, with the hope of mining their data to extract the type of gold nuggets that will enable them to beat the market.

    The opportunity is open to a wide range of startups.  Many tech companies these days generate an interesting “data exhaust” as a by-product of their core activity.  If your company offers a payment solution, you may have interesting data on what people buy. A mobile app may accumulate geo-location data on where people shop or how often they go to the movies.  A connected health device may know who gets sick when and where.  A commerce company may have data on trends and consumer preferences. A SaaS provider may know what corporations purchase, or how many employees they hire, in which region. And so on and so forth.

    We may be calling this alternative data right now, but it is almost certainly just a matter of time before it simply becomes: the data. 

    I like the term “data exhaust” that Matt uses, because it feels like it accurately captures what is going on right now. The new economy is producing a lot of byproduct. If you clean it up and package it in the right way, then you might be creating additional value. But if you don’t, then it’s probably just exhaust.

  • I love neon

    “As the manufacture of storefront signage becomes increasingly standardized,” says a circular from Berlin’s Buchstabenmuseum, “the tradition of idiosyncratic signs created by skilled craftspeople, reflecting regional differences and a firm’s unique character, is dying out.”

    The above quote is from this Globe and Mail article talking about the lost art of sign making and about an exhibition that starts today (until January 27) in Montreal at the Media Gallery of Concordia University’s Communication Studies and Journalism Building. It is called Tel Quel / As Is and it is by the Montreal Signs Project.

    Cities all around the world are facing a decline in distinctive local signage, which is not all that different than the decline in regional architecture. We are living in a global village.

    Montreal has responded with the above project. Berlin has responded with the Buchstaben Museum (letter museum). And here in Toronto, Mark Garner of the Downtown Yonge BIA has been trying to convert one of our laneways into a haven for restored Toronto neon signs. Great idea.

    It can be challenging to repurpose old signs. There are often issues of appropriateness and scale. Sometimes a new or renovated building looks good with its old signage. But in other cases – and perhaps more often than not – it wouldn’t. So then what do you do with it?

    Still, it behooves us to try. Signs, like buildings, are a snapshot of a moment in time. They are part of the environment that we create for ourselves. They are part of our history.

  • Blaze Laserlights

    This is a great idea:

    It is a bicycle light – by a London-based company called Blaze – that forward projects a bicycle symbol 6m in front of you as you ride. It also has a really bright white light.

    They will be (or have been) installed on London’s entire bike-share fleet and they are currently being piloted in New York City. Here is a video of it in action.

    One of the things I always watch for when I’m cycling is being in a car’s blindspot. Signalling seems to be a dying art, so you never know when someone might turn into you. If this light is able to project in front of the car and signal to the driver that a cyclist is nearby, then I could see this being a big safety improvement. Of course, this is just one scenario where a light like this might be helpful.

    Have any of you tried it?

    Image: Blaze

  • Episode 15: The Master Builder

    My friend Ben Stevens runs a blog called Skyline where he interviews people involved in the built environment (architecture, real estate, planning, and so on). You might remember that I did an episode with him about a year ago where we talked about the overlap between architecture and development.

    His most recent episode is with San Diego-based architect-developer Jonathan Segal. I’ve mentioned Segal before on this blog and that’s because he is well known and admired in certain circles for (re)creating a process that places the architect in the position of “master builder.”

    He is singularly driven by one goal: to have ultimate control over the architecture that he creates. Making money is secondary. It is a byproduct of goal number one.

    To achieve this, he has worked to cut out every conceivable middle person. Design is in-house. Construction management is in-house. Property/asset management is in-house. He even avoids bringing on investors for his projects, out of fear that they will start to dictate what he can and can’t do.

    If this approach resonates with you, I definitely recommend you watch the interview. Click here if you can’t see it below.

    [youtube https://www.youtube.com/watch?v=r7UT–CAS1g?rel=0&w=560&h=315]

  • Toronto is getting an i-team

    Bloomberg Philanthropies runs a program called Innovation Teams (also called i-teams). It is one of their approaches to driving innovation within cities. What they do is provide grant funds to cities in order to help them assemble a local “i-team”, which they will fund for up to 3 years. 

    They, like me, believe that cities are uniquely positioned to solve some of the world’s most challenging problems. So the teams essentially function as in-house (in-city?) innovation consultants, using an approach that relies heavily on research and data.

    Here are some of the successes they’ve had so far (excerpt taken from here):

    “In New Orleans the i-team helped the city reduce its murder rate by 20% in less than two years. In just sixteen months, Memphis’ i-team leveraged the approach to fill 53% of the empty storefronts in key commercial tracts of the city, giving hope to small business owners and reinvigorating the city’s core. Mayors in pioneer cities successfully deployed their i-teams to decrease homelessness, reduce youth violence, and stimulate economic growth, and these i-teams continue to be re-deployed to solve new and pressing problems.”

    Because of these early successes, the program is expanding. Their latest round of funding will bring i-teams to Durham, Baltimore, Austin, Detroit, Anchorage, Be’er Sheva (Israel), and Toronto. This will be the first i-team in Canada. And I am excited to see what they are able to accomplish.

  • Drone fly through of Hamburg’s Elbphilharmonie

    It’s somewhere around 7 years behind schedule, but Hamburg’s Elbphilharmonie concert hall opened its doors this week for its first ever public performance. Designed by Herzog & de Meuron, it was initially scheduled to open in 2010 at a cost of €77m. Instead it cost €789m and its first performance was, well, this week. This is according to The Spaces.

    If by chance you didn’t attend the official opening ceremony (and even if you did), I recommend you check out this interactive drone fly through. It’s a neat (and potentially transformative) way to see the building, experience its architecture, and understand its setting on Hamburg’s harbor. Make sure you turn on your sound. It is a concert hall, after all.

    You can also watch the opening concert (January 11, 2017) here on YouTube.

  • The suburban Ponzi scheme

    The following image is a geographic representation of Lafayette, Louisiana’s finances. It is from this excellent article by Charles Marohn.
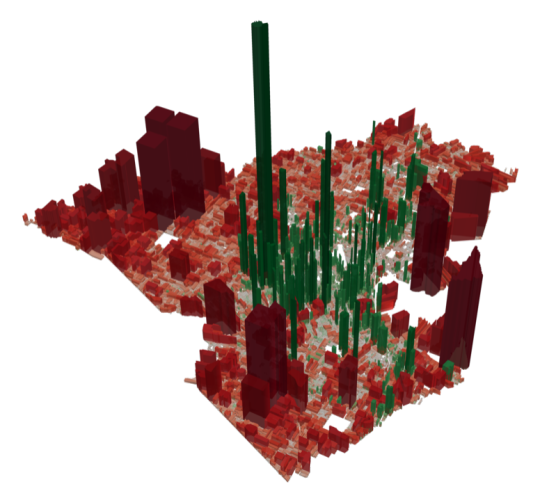
    What this 3D map shows is the city’s revenues and expenses by land parcel. The green areas are where the city is making a profit (revenues exceed expenses) and the red areas are where the city is operating at a loss (expenses exceed revenues). The height of each extrusion indicates just how much profit is being made and how much loss is being incurred.

    The glaring takeaway from this study is this: not only are post-war land use patterns environmentally unsustainable, but they are also fiscally unsustainable. The tax base is simply not there to pay for the infrastructure that gets built alongside it.

    They – the authors of this study – estimate that the infrastructure revenue gap for the median home in Lafayette is about $8,000 per year (median household income is $41,000). And yet despite this shortfall, it is common to look at infrastructure spending as a desirable economic stimulus.

    The following paragraph really brings this point home:

    “All of the programs and incentives put in place by the federal and state governments to induce higher levels of growth by building more infrastructure has made the city of Lafayette functionally insolvent. Lafayette has collectively made more promises than [it can] keep and it’s not even close. If they operated on accrual accounting – where you account for your long term liabilities – instead of a cash basis – where you don’t – they would have been bankrupt decades ago. This is a pattern we see in every city we’ve examined. It is a byproduct of the American pattern of development we adopted everywhere after World War II.”

    Thank you Daniel for sharing this article with me. 

    If you only read one other thing today (besides my blog), I recommend you read Charles’ article. It’s called: The real reason your city has no money.

  • Uber Movement

    Uber just announced that it will be providing access to the (anonymized) traffic flow data generated from its over 2 billion rides. This new product is called Uber Movement and the goal is to help cities make better infrastructure decisions. Because indirectly, that also benefits them. 

    Here’s an excerpt from TechCrunch:

    “We don’t plan infrastructure, we don’t plan cities, we’re never going to do that,” explained Uber Product Manager Jordan Gilbertson in a briefing. Not controlling those aspects of Uber’s business means that it must do whatever possible to influence their improvement indirectly, which Movement can certainly help to do. More efficient transportation in a city in general means more efficient Uber service delivery, happier customers and better usage rates.

    You can request access to Uber Movement today. But the service will be made available first to city planners and policymakers, and then to the general public. I would be very curious to see what the data reveals for Toronto, as well as for other cities.