Daily insights for city builders, delivered every morning at 6 AM ET. I’m Brandon Donnelly — a Toronto-based real estate developer and founder of Globizen. I’ve been writing here since 2013.

  • When asset light becomes an asset liability

    April 22, 2026 · View original


    One of the great features of the so-called gig economy is that many of its businesses operate with an asset-light model. Uber, for instance, relies on drivers showing up with their own cars. This is the opposite of, say, the real estate industry, which, for a lot of business models, is both capital-intensive and asset-heavy.

    But there is one problem with the asset-light model, and it’s that it may not work forever. The Financial Times just reported that Uber has committed to spending $10 billion over the next few years on actual cars and on equity investments in various strategic companies.

    For instance, earlier this month, electric vehicle company Lucid announced that Uber will be investing $500 million in the company and buying at least 35,000 of its cars.

    This is gig-economy blasphemy, but it’s very obviously an existential concern for the company. Uber needs to be in the AV race, or else asset-light could be an asset-liability. The thing that helped Uber become successful in the past now seems to be what they need to overcome in this new mobility race.

    On a loosely related note, I find it somewhat amusing that cities are now starting to push back against robotaxis out of fear that they will displace Uber drivers. If you were following Uber in its early days, you’ll know that cities fought the company vehemently because of the taxi lobby. Now they’re trying to protect it.


    Cover photo by Erik Mclean on Unsplash

  • The market logic of Japanese rail

    April 21, 2026 · View original


    We have spoken many times before about the fact that Japan is built around rail-oriented urbanism. But if you have the time right now, I’m going to suggest that you read this longish article by Matthew Bornholt & Benedict Springbett called “Why Japan has such good railways,” because nowhere else in the developed world uses rail for passenger kilometres more than Japan, and they explain why.

    One common hypothesis, which is mentioned in the article, is that it’s largely cultural. The Japanese are rule-abiding collectivists who are more willing to take public transit compared to us selfish and individualistic North Americans. But this doesn’t seem right. In fact, one could argue that the Japanese solution is actually more free-market oriented.

    The Japanese rail model seems to work so well because (1) most of the network is private, (2) liberal land-use policies have allowed Japan’s urban centres to develop enough density to properly support the use of rail, and (3) the rail operators make money in a bunch of other ways beyond rail. They’re typically also in the business of real estate.

    Here’s a quote from the article by the president of the Tokyu Group that I absolutely love:

    > I think that though we are a railway company, we consider ourselves a city-shaping company. In Europe for instance, railway companies simply connect cities through their terminals. That is a pretty normal way of operating in this industry, whereas what we do is completely different: we create cities and then, as a utility facility, we add the stations and the railways to connect them one with another.

    This is a fundamentally different model that allows rail companies to capture some of the value that they inherently create. To use the example of Toronto’s Eglinton Crosstown line, it’s the difference between saying, “I’m going to build a rail line and then, presumably, other stuff will happen,” and, “I’m going to develop this midtown corridor and then I’m going to run rail underneath it to maximize value creation.”

    If Japan can do it, so can we. Ironically, a big part of it means easing land-use controls and allowing transit-oriented development to simply be what it wants to be — dense and proximate to rail.


    Cover photo by Mylène Larnaud on Unsplash

    Charts from Work in Progress

  • Information wants to be free

    April 20, 2026 · View original


    I recently came across a real estate product called LandGlide. It’s an app that provides parcel boundaries and detailed property information for over 99% of the US population. It’s also “available” in Canada, but it doesn’t tell you much about properties here. In the US, you can easily access things like:

    – Owner’s name or legal entity – Mortgage balance and terms – Assessed value and tax amounts – Square footage and year built – Granular details (even down to whether the home has a fireplace)

    The reason for this difference is that in the US, property data is generally considered public record, whereas in Canada, we have stricter privacy laws. But it’s not like we make this information strictly private. We just gate it and make it more cumbersome and costly to obtain through services like GeoWarehouse.

    I know that some of you will argue that it’s better to “sort-of-kind-of” restrict this data from being freely displayed online. But hear me out: this philosophical data difference is an important one that hurts innovation.

    In Canada, property data is monopolized and, therefore, cumbersome and expensive to access. It’s an unnecessary barrier to innovation. In the US, the same kind of data has become commoditized. It’s easy and cheap to access, and so the barriers to building new ideas on top of it are significantly lower.

    For example, Paul Crowe, who is the CEO of a Toronto-based real estate company called House Beat, responded to one of my tweets by saying, “For what I can get in the US for $0.15 / API call from one provider, [it] would cost over $18 per call in Canada, across 2-3 integrations.”

    What this suggests to me is that we’re okay allowing some/all of this data to get out there; we’d just like it to be harder and more expensive to access. Why?

    Information, as the saying goes, wants to be free, which is why I’m so bullish on blockchain technologies. Blockchains are public databases that make information widely accessible and allow anyone to innovate on top of them. As the world continues to move on-chain, we are going to see the enormous benefits that this brings.

    Already, we can see what happens when you don’t have or allow it.


    Cover photo by Jakub Żerdzicki on Unsplash

  • Competing against the market

    April 19, 2026 · View original


    I just saw The Real Estate God argue the following (on Twitter): “What people don’t understand about the S&P is that every single person in the country who has money is also invested in it. When your money goes up 15%, so does everyone else’s. You gained zero relative wealth. You need to outperform the S&P if you want to actually get ahead.” The implication of this is that when you then go out and compete for a “fixed pool of high-quality assets” — such as a home — you have no comparative advantage against everyone else.

    Yes, and no.

    I think this tweet is true in a narrower, segmented sense. One of my personal life philosophies is that it’s important to do things that others can’t or aren’t willing to do. It’s important to be disciplined, make sacrifices, and put in the work; otherwise, you revert to the mean. You have to be different! It’s one of the reasons that I’ve maintained a daily blog for nearly 13 years. I enjoy it and there are benefits to doing so, but it’s also painfully difficult and not something most people care to do (perhaps rightly).

    Small improvements and outperformance can also make a huge difference when looking at a long enough time horizon. Consider this simple table showing a starting balance of $100k and annual returns ranging from 10% to 15% per annum.

    If 10% represents the expected return of “the market,” look at how much of a difference even one percentage point (increase to 11%) can make. Over a 30-year period, it’s more than half a million dollars. And between 14% and 15%, the delta is over $1.5 million! The simple and commonly discussed lesson here is that small incremental improvements compound and can make all the difference when applied with consistency and discipline.

    But to find alpha in this way (outperformance), you arrive at a subset of “being different.” To outperform the market, you generally need to be right about something that most people think is incorrect. Because if everyone believes something to be true, it’s not being any different; it’s just “the market” and there’s no alpha in that.

    So in this sense, if you want a high degree of relative wealth creation, if you want to retire early with a yacht in Monaco, and you don’t want to wait for the decades of compounding to start delivering the bulk of its fruit, then yes, you will likely need to look beyond just the S&P and take on additional risk to get there.

    This is the “yes” part. Now let’s consider the “no.”

    It is estimated that about 40% of Americans have no exposure to the stock market, that the wealthiest 10% own roughly 93% of all outstanding stock shares, and that the wealthiest 1% own about 50% of the market. Canada exhibits a similar story of high concentration, although it’s less extreme, and Canadians tend to be more invested in residential real estate compared to stocks and business equity.

    Regardless, there is a question of allocation. When the market goes up 15%, it doesn’t affect everyone equally, and it actually increases overall inequality given the above concentrations. Though if you’re competing for a €6M apartment in Paris, you are admittedly competing within your narrow socio-economic band against people who probably have exposure to equity markets.

    There’s also a behavior gap. If you buy the S&P 500 and hold it for 30 years, you would be an extreme statistical outlier. Most people don’t do this. They get emotional, they sell when it falls, and they try to time the market. Here, for example, is a study that found that in 2024 the average equity investor earned 16.54%, compared to the S&P 500’s 24.02%.

    > Despite strong performance in the equity markets, investors continued to underperform due to their behavior. Withdrawals from equity funds occurred in every quarter of 2024, with the largest outflows taking place just before a major return surge.

    So even if you are just buying the S&P 500, there are still ways to be different and achieve relative outperformance. You just have to be patient and have the right temperament.

    That said, even if you were extremely disciplined and you behaved for, say, 30 years, it would still be mathematically impossible to achieve something like Elon Musk-level wealth. You could be a multimillionaire with Monaco yacht level wealth, but not a centibillionaire. For that, you’ll need to actively take on more risk and, yes, outperform the market.


    Cover photo by Sean Pollock on Unsplash

  • What are your luxury criteria?

    April 18, 2026 · View original


    I recently watched a few episodes of L’Agence on Netflix. I don’t watch much TV, but it is somewhat shocking that I haven’t gotten more into this show before. It’s about beautiful real estate and all things French, which are unapologetically two of my favourite things.

    Another great feature of the show is that everyone seems to be in their late 30s and shopping for a €6,000,000 apartment with a rooftop terrace and views of the Eiffel Tower. It’s a great way to start questioning all of your life decisions.

    In fairness, the buyers are varied, but I do find it interesting that there are some recurring purchase criteria. Many of them want something “central.” Many of them have kids and have no hesitation about raising them in an apartment. And many of them have a non-negotiable desire to be able to walk out their door to amenities without having to drive.

    All of this really resonates with me, but it obviously isn’t true for everyone or for all geographies. “Luxury,” which is the focus of this show, means different things to different people. What are your criteria?


    Cover photo by Alexander Kagan on Unsplash

  • Toronto cycling year in review

    April 17, 2026 · View original


    The City of Toronto just released its 2025 Cycling Year in Review report. You can download it here. At the highest level, Toronto is now considered to be the 7th most bike-friendly city in North America, according to the Copenhagenize Index. Our snowier sibling, Montréal, is number one on the continent. And globally, we’re ranked 55th.

    Neither of these positions is particularly impressive given our scale and prominence as a global city, but progress is being made. In 2025, City Council approved 33 km of new bikeways, installed 14.11 km, and upgraded 9.02 km. Our infrastructure continues to get better.

    What I find particularly noteworthy and telling, though, is the adoption of the city’s bike share network. 2025 was another record year, with 7.8 million rides, representing a 13% increase from 2024. We’re still not at the level of Montréal, which recorded 13 million rides in 2024, but adoption is growing quickly.

    We have gone from around 665,000 rides in 2015 to nearly 8 million in the span of a decade. That’s a compounded annual growth rate of approximately 28%! Once again, we are reminded that if you build it, and make it easy and safe, more people will ride bicycles.


    Cover photo by Jason Ng on Unsplash

  • Are HST and DC rebates enough?

    April 16, 2026 · View original


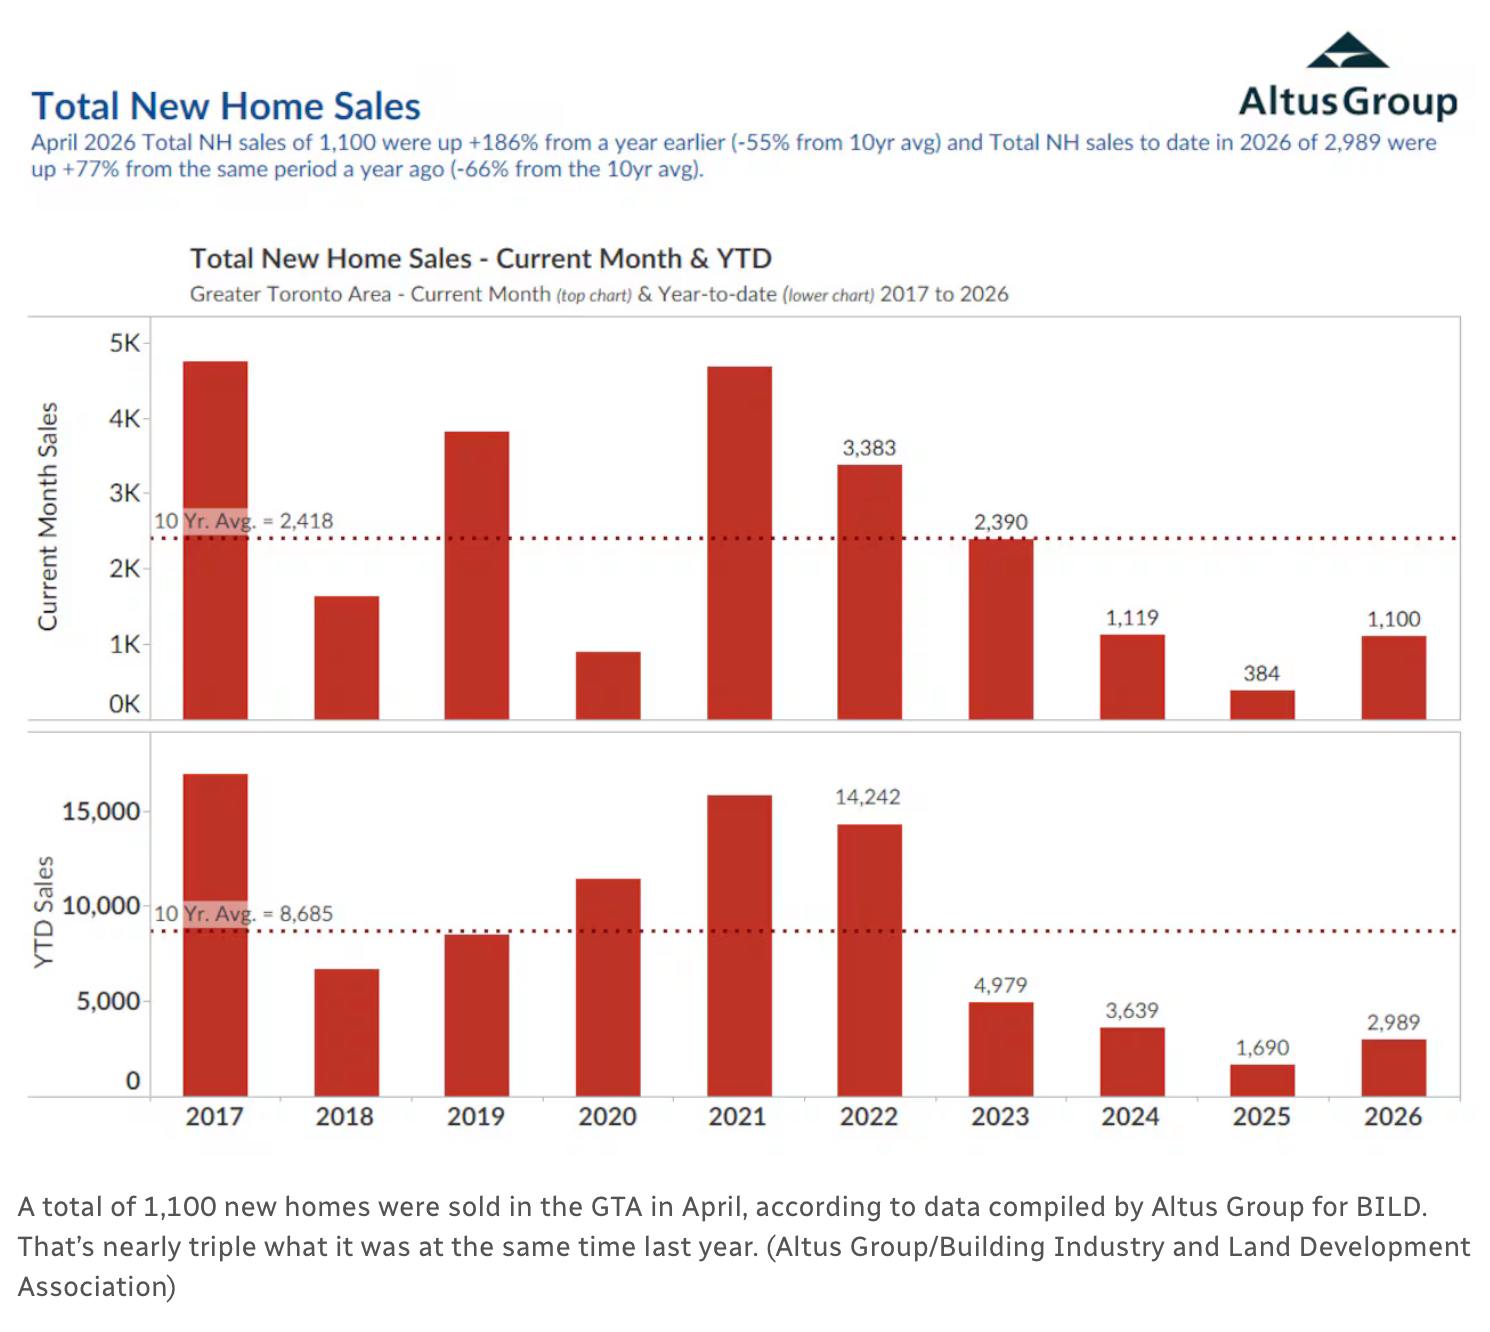
    In addition to the recently proposed HST rebate for new homes, the federal government and the province of Ontario announced that they will be providing funding to help municipalities reduce their development charges by up to 50% over the next three years. And according to some estimates, these two measures will temporarily cut the cost of building a new home in Ontario by something in the range of 15-20%.

    From what I have seen, most, if not all, of these savings are now going to the consumer. As Mike Moffatt points out in this recent Globe and Mail article, developers are passing them along because of competition, because they need to compete with lower-priced resale homes, and because, frankly, it’s the only way to try and unstick this market.

    What is not so clear, though, is whether this is enough. Moffatt argues that “now that new homes can be sold at prices that make them viable to build, more homes will be built, adding further downward pressure on resale prices.” This is certainly one of the policy goals — to get more developers building again. But I don’t think we’re there quite yet. I guess we’ll find out soon enough.


    Cover photo by Jaipreet Singh on Unsplash

  • Success is making Miami into something else

    April 15, 2026 · View original


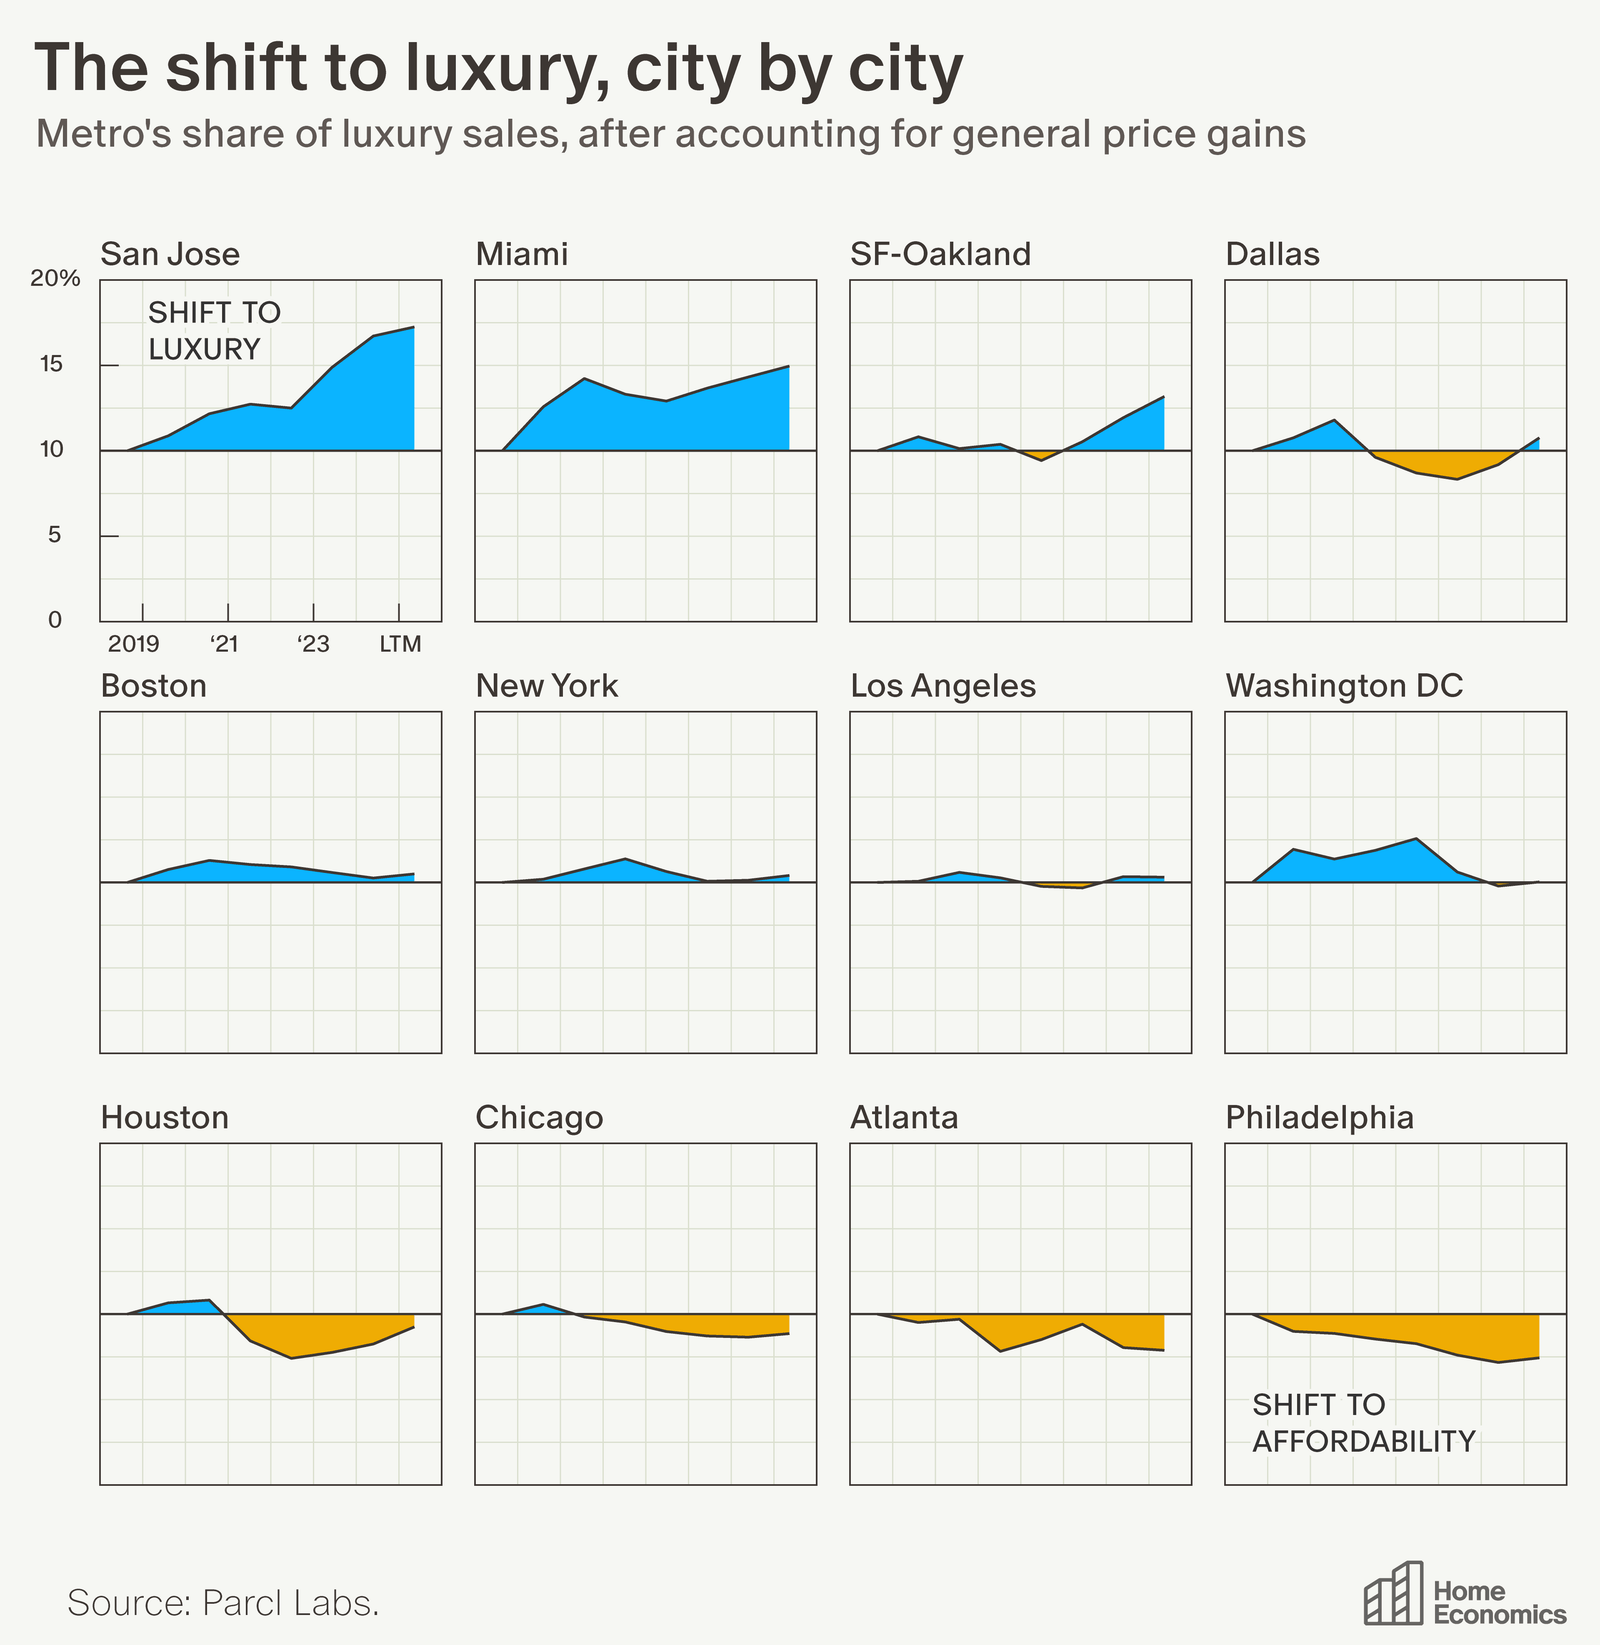
    Miami is a popular place these days for a whole host of reasons, namely that it’s sunny and warm, it doesn’t have state income taxes, and the broader market doesn’t seem to think that climate risk will pose an insurmountable challenge in the foreseeable future.

    But beneath the surface, there are shifts taking place. HOA fees and insurance premiums are rising (some people have a different view of climate risk), and the city is becoming increasingly unaffordable for the middle class.

    Between July 2024 and July 2025, Miami-Dade County lost an estimated 10,115 residents. This was the third-largest absolute population drop of all US counties last year, though it should be noted that this can be largely explained by changing immigration policies and a meaningful decrease in international migration.

    There are still plenty of people moving to the city; they just tend to skew richer. According to data from 2023, the average inbound salary was $178,000, and the average outbound salary was $89,000. The net result (via the Miami Herald):

    > Higher earners are moving here, lower-wage workers are leaving and the population as a whole has started to shrink. That’s not good for a community’s long-term economic health.

    Wealth is a good thing. But is it now too much of a good thing? At the very least, it demonstrates the fragility of finding the elusive equilibrium between being a successful city and remaining affordable and accessible to the middle class.

    To paraphrase Jane Jacobs, “The more successful a city is, the more it is under pressure to be something else.”


    Cover photo by Sarah Thorenz on Unsplash

  • How an architect mandate segments the French housing market

    April 14, 2026 · View original


    It is very common for jurisdictions to mandate the use of a licensed architect when building homes and buildings above a certain size. This is true in Ontario, and it’s true in places like France, though the thresholds can vary widely and change over time. Currently, the threshold is 150 m2 in France. Okay, so what? Well, it turns out this simple rule has second-order consequences, as they often do.

    Here’s a fascinating research paper by Antoine Levy titled Regulating Housing Quality: Evidence from France. One of the things he looks at is the distribution of floor area in new housing units over time, from before there was an architect requirement threshold (ART), to the moments where this threshold was gradually lowered:

    Prior to there being a threshold (1976), the chart shows a positive skew, but with a clustering of homes somewhere around 100 m2. Importantly, the distribution shows a smooth progression. But once an ART is implemented, the distribution then starts to show a clear spike right before the threshold, followed by a cliff and a “missing mass.”

    This, of course, makes sense. The market is pushing up against the glass to avoid having to use and pay for an architect. And the “missing mass” is the market shifting supply to below the threshold, or sufficiently beyond it. I mean, if you’re going to surpass the threshold, you may as well do it confidently.

    Now here’s where things start to get more interesting. Levy finds that this threshold acts as a focal point that segments the market. Households above the threshold tend to have higher incomes, and homes just past the limit were on average 8-10% more expensive to build. This additional cost cannot be justified by the addition of the architect’s fee alone.

    On the other side of the threshold, the concentration of demand “up against the glass” was shown to create economies of scale through more standardized home design and production. In other words, the threshold incentivizes the market to get really good at designing and building a certain scale of home.

    It was also shown to unintentionally promote greater housing density, because what the threshold does is create a soft cap on housing consumption for a large segment of the market. As you can see in the bottom right chart above, it effectively pulls supply back and under the threshold, away from larger homes and larger lots.

    It may seem fairly innocuous to mandate that people use an architect above a certain scale, and I will forever be a proponent of great design, but as Thomas Sowell once said, “there are no solutions, only trade-offs.”


    Cover photo by Alex Tyson on Unsplash

    Chart from Regulating Housing Quality: Evidence from France

  • Land is not the problem right now

    April 13, 2026 · View original


    This is a follow-up to yesterday’s post about too many people allegedly speculating on underutilized urban land. Over the weekend, I saw Patrick Condon, a professor at UBC and author of the book “Broken City: Land Speculation, Inequality, and Urban Crisis,” argue that “urban land is the impossible-to-ignore driver of the housing crisis.” Is it really? Let me offer the developer’s perspective and explain what has happened in Toronto.

    It is certainly true that the price of development land appreciated rapidly toward the end of the last cycle and that, at the time, there was enough margin for developers to bifurcate the work of zoning land and actually building out projects. But since 2022, that has gone away, and we have seen a dramatic correction in pricing.

    According to Bullpen and Batory’s Q4-2025 High-Rise Land Insights Report, the average sold price for a high-density site in the GTA has gone from $119 per buildable square foot in 2019 to $78 per buildable square foot at the end of last year (a ~34% decline).

    But this is a blended average. In my experience, the falloff in pricing has been even more dramatic and, in many cases, land now feels illiquid. With rents declining and new condominiums not selling, what’s the value? Land prices are a function of what you can do with the land. If what you can do disappears, so too does the value. Land is not the problem right now.

    But even if we were to ignore current market factors, it’s debatable whether land prices were really the primary driver of unaffordable housing. About six years ago, Toronto developer Urban Capital published a pro forma comparison between a project they did in 2005 and a project they were doing in 2020.

    What they found over this 15-year period was that construction costs increased by 91%, land costs increased by 160%, and government fees and taxes increased by some 413% (development charges alone increased by 3,244%!). The price of development land certainly increased, surpassing the rate of inflation, but we can’t ignore that roughly a third of the price of a new home became government fees and taxes.

    Today, there are countless development models that don’t pencil even if you plug the land value in at $0. That tells me that we’ve got bigger problems.


    Cover photo by Patrick Tomasso on Unsplash