Daily insights for city builders, delivered every morning at 6 AM ET. I’m Brandon Donnelly — a Toronto-based real estate developer and founder of Globizen. I’ve been writing here since 2013.

Category: Real Estate

  • Patch Homes announces $5mm Series A round to grow fractional home equity platform

    There are a number of home equity startups in the marketplace today.

    A few years ago I wrote about an alternative product to HELOCs or home equity loans, called Point. And earlier this year, I wrote about a startup, called Landed, that is helping “essential professionals,” such as teachers, with their down payments. They’ll contribute up to 10% of the value of a home in exchange for a share in any future gains, or losses.

    Today, another startup in the space — Patch Homes — announced a $5mm Series A round. From what I can tell, it appears to be similar to Point in that it involves the fractional sale of home equity. Though, to be clear, the model is distinct from the fractional homeownership that is popular in many high demand vacation destinations. Here’s a bit more on how the product works (source):

    The Patch model enables homeowners to “tap into” their home equity by selling 20–40% to Patch’s affiliate, Patch Capital, which shares in both the upside and downside. The homeowner remains in control of her or his home for the life of the relationship and exits via a sale or refinances in 7–10 years.

    While this product is not for all homeowners, it provides a new and important financing option. The Fed estimates that home equity ownership in the US is $15 Trillion. It makes no sense that the only financing options are additional debt or a complete sale of the property. Patch gives homeowners the option to de-lever their personal balance sheet or otherwise raise cash. Clients have used Patch proceeds for numerous reasons, the most popular of which are to pay off debt, increase liquid savings and finance home improvements.

    I am not surprised to see this gaining momentum. The biggest benefit is that it gives you partial liquidity (i.e. cash up to $250,000), without having to sell your property or take on additional debt service payments. It’s equity, not debt. Fred Wilson, an investor in the company, calls it fractionalizing home equity.

  • Snøhetta completes energy positive building in Norway

    Snøhetta has just completed an office building in Trondheim that produces more than double the amount of electricity that it consumes. If you recall my recent post on Norway’s new coastal highway, you may remember that Trondheim is the northern terminus of highway E39. I mention this because of access to sun. Latitude 63.43.

    The office building is about 18,000 square meters and it is wrapped with about 3,000 square meters of solar panels. The roof is angled at 19 degrees in order to maximize sun harvesting, and any excess electricity is fed back into the city’s grid / neighboring facilities. Large batteries also help to help carry the building through the winter months (again, latitude 63.43).

    Here are a few photos of the roof (via Dezeen):

    I wish I had more of the details so that I could see how the numbers pencil. Hard costs, utility costs, office rents, government incentives/disincentives, embodied energy in the batteries, and so on. Because this looks like an extraordinary accomplishment for a city that is remarkably north.

    Images: Dezeen

  • Tasty data

    A recent study and research paper by the MIT Senseable City Lab — called, Tasty Data — has discovered that restaurant data alone can be used to accurately predict location-based factors such as daytime population, nighttime population, number of businesses, and overall consumer spending within a specific geography.

    They started by pulling restaurant data from Dianping (Chinese equivalent of Yelp) for 9 Chinese cities: Baoding, Beijing, Chengdu, Hengyang, Kunming, Shenyang, Shenzen, Yueyang, and Zhengzhou. They then paired their Dianping data with other available data (such as aggregated mobile phone data) and used machine learning to search for any correlations.

    Below is a diagram of “nighttime population” in Beijing. They are using a 3 km2 grid.

    If you’re a regular reader of this blog, you’ll know that I like these kinds of studies. By 2020, it is estimated that 1.7MB of data will be created every second by every person on earth. The numbers are staggering. And yet, “official” data sources, such as census data, remain slow and fairly limited. Studies like this one continue to show us what’s next.

    Image: MIT Senseable City Lab

  • Personalizing outdoor spaces on multi-family buildings

    I am still making my way through (and editing) my photos from Lisbon and Malaga. Here is one that I took from the Playa de La Malagueta. I also posted it to Twitter and Instagram and asked: Should we encourage the personalization and customization of outdoor spaces on multi-family buildings?

    This building overlooks the beach and the Alboran Sea. If you look closely, you’ll see that a number of the balconies have been modified to include different kinds of awnings and shade structures. And some look to have been converted to interior space.

    A few of you seem to support this level of customization, provided that the overall design integrity of the building is maintained. And I would agree that in this particular instance, it seems to work, which is actually why I took the photo. It gives the facade life.

    I recall seeing instances of this in Toronto, but generally speaking it’s not encouraged or allowed. In condominiums, outdoor spaces attached to units are typically defined as “exclusive-use common elements.”

    The challenge, here, lies in the subjectivity of “maintaining the overall design intent of the building.” I’m not sure how you codify that, unless you pre-design the options. Perhaps that’s one way of doing it.

  • Immaculate construction

    Emily Badger’s recent piece on “how ‘developer’ became such a dirty word” has been getting passed around within the industry over the last few days. I had a chuckle when I read this bit:

    The notion that development is inherently bad, or that developers are inherently bad actors, seems to ignore that the communities residents want to protect from developers were once developed, too, and often by people who made money at it. (That is, unless you believe in “immaculate construction.”)

    The article hits on a number of points that are absolutely true. There’s generally a lack of understanding around the economics behind new housing. And the cost structures, today, are dramatically different compared to the suburban-industrial complex.

    To provide one example, our cost consultant, Finnegan Marshall, recently shared with me a chart (dated April 2019) that broke down the various government fees that typically make up every new condo suite in Toronto.

    What it showed is that between 20-24% of the price of a new condo is generally compromised of government fees and taxes that span all three levels of government. This includes everything from development charges (impact fees) to parkland dedication.

    Similarly, the article quotes one developer from Montgomery County who estimates that the impact fees alone for his projects are usually upwards of $60,000 per housing unit. (This is pretty cheap compared to Toronto.)

    I raise this as an example because development charges/impact fees have become an important source of revenue for cities across both Canada and the US. They often offset lower property taxes. (Whether this is appropriate is an entirely other debate.)

    And so I find it paradoxical that many homeowners would like to simultaneously see lower property taxes, no new development, and more public services and infrastructure.

    Photo by EJ Yao on Unsplash

  • Junction House Sales Gallery wins “Best of Canada Award” from Canadian Interiors

    Today I’m excited to announce that the Junction House Sales Gallery has just received a Best of Canada Award (2019) from Canadian Interiors. Link, here. Shout-out to Dialogue 38, Vanderbrand, Unique Urban Homes, Superkul, and the rest of the team for making it happen. We are fortunate to have had such a cool space to work with. It was previously occupied by the art studio, Moss & Lam. And so from the very beginning the idea was always to find the right balance between old and new, raw and unpolished, playful and luxurious.

    Some of you may also not be aware that before we converted the above studio into a condo showroom, we donated it to a number of creative groups who were looking for space, but maybe didn’t have a lot of (or any) money. Lost & Gone used it to host an immersive rendition of Romeo & Juliet (video of the performance, here). DJ and designer Steve Aoki used it to launch one of his Dim Mak collections (okay, he has a lot of money). And Secret Walls used it for a live art battle. In fact, Secret Wall’s markings are still present within the Gallery if you look up toward the ceiling.

    Before we came along, the space was used as an art studio. That’s an important part of the Junction House story and we wanted to commemorate that in the build out of the Sales Gallery (the “Gallery” part is meant to reference this past use). It is also one of the reasons why we partnered with Ben Johnston for this “Forever” mural on the outside of the building (yes, we see the irony); why we created a place for artists to showcase their work (currently Leeay Aikawa); and why we commissioned a celebrated local artist (Thrush Holmes) to create a custom piece for the future lobby of Junction House.

    Art matters.

  • Driving distance between two adjacent homes

    I came across this tweet by Sean Galbraith last night. You will probably need to click through to see the full extent of the photos. It is a series of images showing two back-to-back houses. The lands touch one another. But if you were to drive from one house to the other, it would take you about 18 minutes because of the area’s road network. Approximately 7.1 miles.

    This, of course, is far from urban. It would take over two hours to walk this same distance (assuming an average walking speed of 1 mile every 18 minutes). If you’re an urbanist, this is surely galling to you. But I think it’s also important to remember that this is, at least partially, a result of a consumer preference for dead end streets that limit through traffic.

  • Why Phoenix is ground zero for algorithmic home buying

    I have been writing about algorithmic home buying on the blog since Opendoor launched back in 2014.

    I don’t have anything new to report on that today, but this recent article from the WSJ is interesting in that it talks about why Phoenix, in particular, has become ground zero for algorithmic home buying, as well as for institutional investors looking to buy cheap rentals.

    Across Opendoor, Offerpad, and Zillow, nearly 500 homes are now being purchased — largely by software — in Phoenix each month:

    One of the reasons why Phoenix is well suited to these platforms is that the housing stock is cheap and fairly homogenous. (The WSJ calls it “stucco sprawl.”) This makes it easier for the algorithms to put a value on the homes.

    A big chunk of the housing stock is also relatively new. Just over 36% of it was built in 2000 or later. And it tends to trade fairly often. Below is the percentage of homes in 2018 that were resold within a year of purchase.

    It’s also worth noting that Arizona is a non-recourse state, meaning you’re typically not personally liable if you default on your home mortgage. You simply hand back the keys. So it’s viewed as a fairly risk tolerant state, which may be one of the reasons why Phoenix’s median home price chart looks like this:

    I’ll end with this quote from the article: “It’s the dawn of e-commerce for real estate,” said Zillow Chief Executive Rich Barton. “Phoenix is ground zero.”

    Charts: WSJ

  • From urban to suburban

    The US Census Bureau just released its population estimates for 2018. As has been the case in previous years, the counties that added the most people (largest numeric growth) are all located in the south and west. Texas holds 4 out of the top 10 spots.

    Here is a Tweetstorm by Jed Kolko, the chief economist of Indeed, with a couple of graphs summarizing the findings (click through to see the full thread):

    Despite the narrative that people are returning to cities and urban centers, the data is pretty clear: the flow of domestic migration within the US is largely from dense urban counties to more suburban — and affordable — ones. Big cities are expensive.

  • Hudson Yards opens in New York

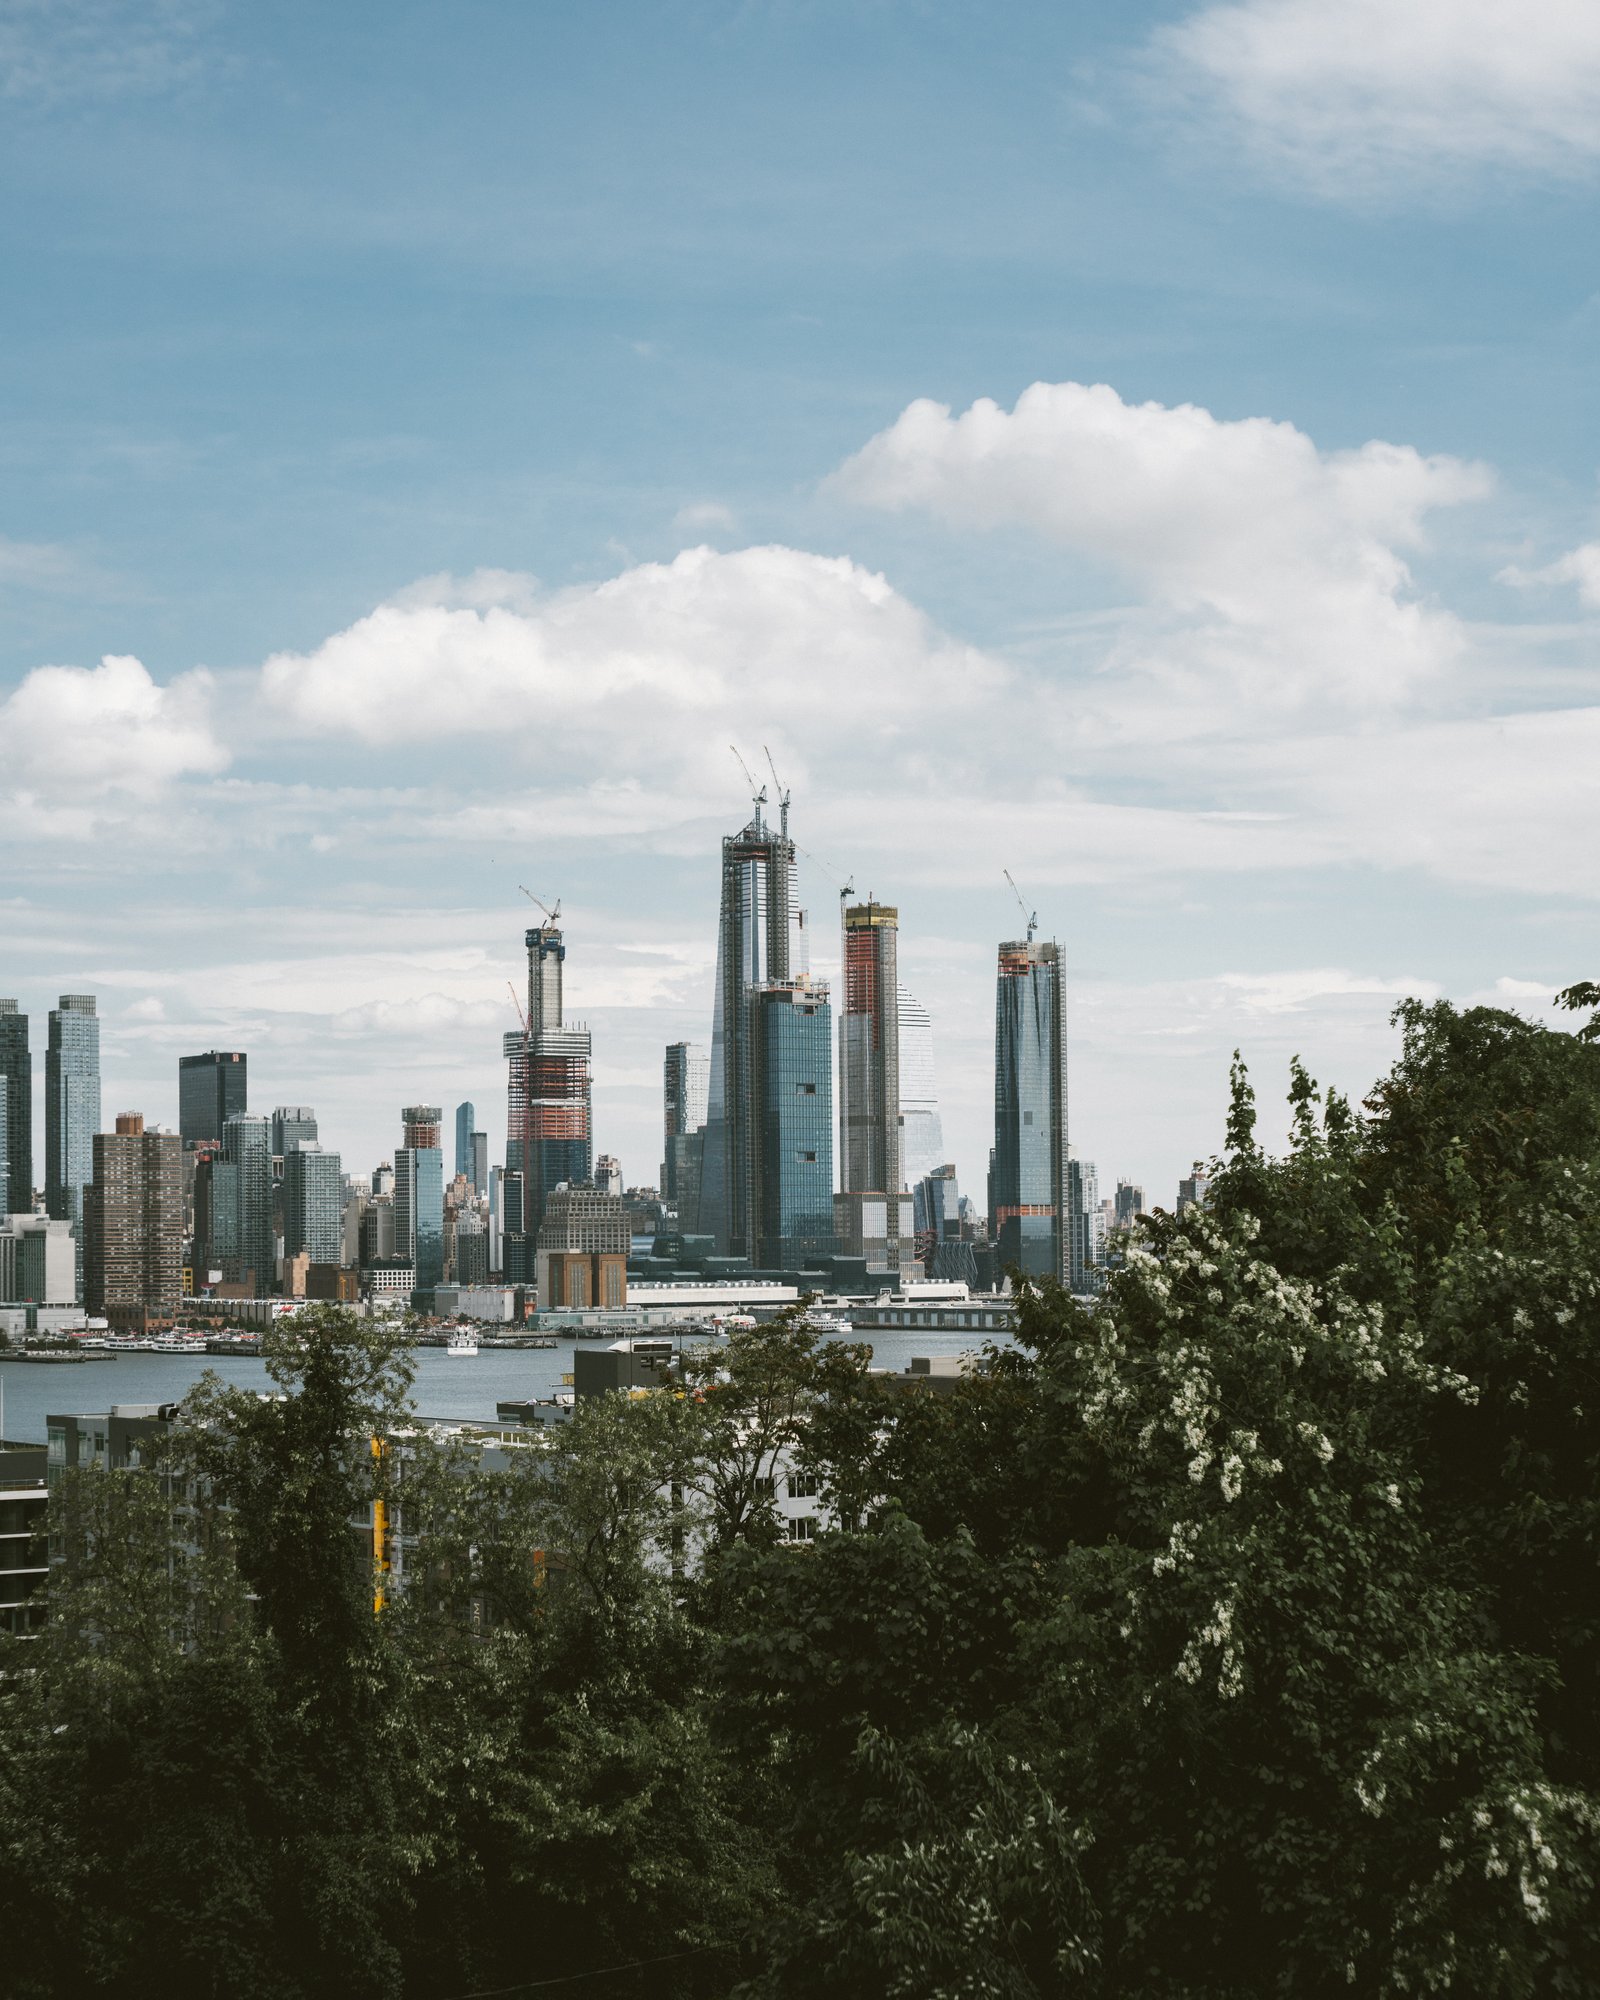
    Hudson Yards officially opened today on the west side of Manhattan. More specifically, the eastern half of Hudson Yards opened. There’s a second phase to come on the western yards. And the highly anticipated observation deck at 30 Hudson Yards — the highest outdoor observation deck in the Western Hemisphere — is also not quite ready. It is expected to open in early 2020.

    Considered the largest mixed-use private real estate project in American history by square footage, Hudson Yards has been in the works for many decades and was previously part of New York’s (failed) bid for the 2012 Olympic Games. Dan Doctoroff, who is now the CEO of Sidewalk Labs, led the bid under the Bloomberg administration.

    So today is a bit of a big deal.

    To commemorate the opening, the architecture critic for the New York Times, Michael Kimmelman, published this searing, but highly visual, piece about the project. I think it is fairly safe to assume that he isn’t a huge fan (he doesn’t seem to love developers either).

    Here’s an excerpt talking about Thomas Heatherwick’s Vessel:

    Purportedly inspired by ancient Indian stepwells (it’s about as much like them as Skull Mountain at Six Flags Great Adventure is like Chichen Itza) the object — I hesitate to call this a sculpture — is a 150-foot-high, $200 million, latticed, waste-basket-shaped stairway to nowhere, sheathed in a gaudy, copper-cladded steel.

    It preens along the critical axis between the High Line and the newish No. 7 subway station at Hudson Yards, hoping to drum up Instagram views and foot traffic for the mall, casting egregious shadows over what passes for public open space, ruinously manspreading beside the Shed, the most novel work of architecture on site, and the only building the private developers didn’t build.

    If any of you have formulated your own opinions about Hudson Yards, I would love to hear from you in the comments below. I’m looking forward to exploring the neighborhood in person sometime soon. If you’re interested in learning more about the project, Curbed also just published, The ultimate guide to Hudson Yards.

    Photo by Sandy Ching on Unsplash