Daily insights for city builders, delivered every morning at 6 AM ET. I’m Brandon Donnelly — a Toronto-based real estate developer and founder of Globizen. I’ve been writing here since 2013.

Category: Mobility

  • Salt Lake City wants to turn Main Street into a pedestrian promenade

    Last year, I wrote about how Salt Lake City wants to build a new linear park around its downtown. That post can be found, here.

    Fast forward to today, and the city’s Department of Economic Development has just published a new comprehensive 215-page study that supports turning Main Street into a pedestrian promenade.

    Specifically, the area running from South Temple to 400 South, and including 100 South from Main to West Temple:

    As part of the study, they highlight a number of successful case studies from around the world, including 16th Street Mall in Denver, Bourke Street Mall in Melbourne, and Queens Quay here in Toronto.

    In the case of Denver, they cite the one-mile stretch as single-handedly generating over 40% of the city’s total downtown tax revenue! And in the case of Toronto, they refer to Queens Quay as a global destination. (Toronto readers, do you agree?)

    Like most city building initiatives, this vision is will take years to realize. But it’s interesting to note that, of the eight design alternatives included in the study, there is already one clear preference within the local community — option B.

    Option B is a pedestrian/transit mall, but with multi-use trails. In other words, it is a no-cars-allowed alternative that would still allow bicycles and scooters. Here’s the street section:

    If you’d like to download a copy of the full Main Street Pedestrian Promenade Study, click here.

  • Waymo’s robotaxis now make 50,000 paid trips every week

    A few days ago, Waymo announced (on X) that its robotaxis are now doing more than 50,000 paid trips every week across Phoenix, San Francisco, and Los Angeles.

    This means that the company is getting an average of 300 bookings every hour or five bookings every minute. And if you add in Austin, where it’s currently offering a limited number of rides, the company has completed a total of over one million rider-only trips.

    In the announcement, Waymo also went on to say that “fully autonomous ride-hailing is a reality and a preferred mobility option for people navigating their cities every day.” All of this is something.

    But perhaps the most important takeaway, right now, is that the company continues to claim — by way of a study from Swiss Re — that its robotaxis are already significantly safer than human-driven vehicles.

    I don’t personally know if this is true, but it’s not hard to believe. I mean, human drivers suck. And assuming it is true, we should all want more robotaxis on the road, because statistically, we would be significantly safer.

    The problem, though, is that autonomous vehicles suffer from a perception bias. We’re all looking for them to fail. If a robotaxi gets into an accident, it’s news. But if a human driver gets into an accident, it’s standard operating procedure. It’ll be interesting to see how and when this flips.

  • US mandates new higher-speed automatic braking for passenger vehicles

    The US Department of Transportation has just finalized a new vehicle safety standard that will require all light-duty vehicles to be equipped with a more advanced form of automatic emergency braking (AEB) by 2029. (Light-duty vehicle = pretty much all passenger vehicles, including SUVs and trucks.)

    Now, most light-duty vehicles on the road today already have some form of emergency braking. What’s noteworthy about this ruling is that it requires a more robust version. Some might say one that works. Specifically, it will need to work at much higher speeds and at night.

    Most of the AEB systems in operation today don’t really work at night — basically at all — and many have shown to be ineffective when it comes to stopping for humans.

    This new standard will require vehicles to automatically brake at up to 90 mph when a possible collision with a car is detected and up to 45 mph when a possible collision with a pedestrian is detected.

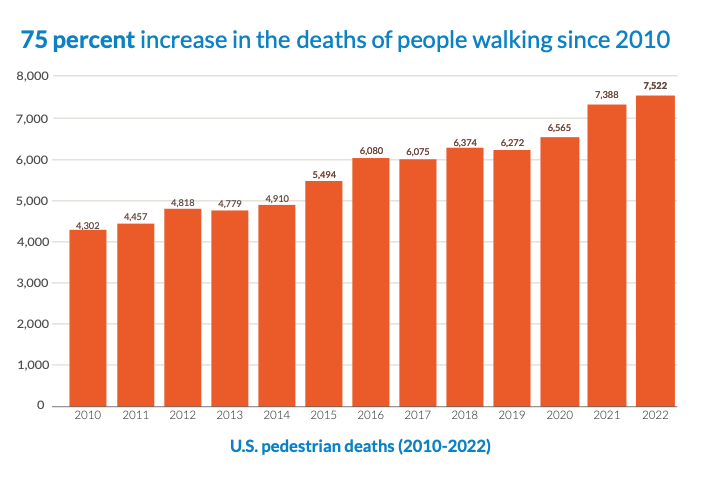
    This seems like a very good thing, especially given the persistent problem we are having with cars killing too many people. But how do we do it?

    From what I have read, this new standard will be pretty challenging to meet without the use of long-range LiDAR, especially since night vision is a requirement. I find this interesting because, even though autonomy is taking a lot longer to arrive than most people anticipated, there’s still meaningful progress being made.

    Here’s to hoping it saves a lot of lives.

  • Why cars keep getting bigger

    Last week we spoke about parking space dimensions. And my point was that these dimensions can dramatically change parking designs in new developments. In the comment section of this post, you’ll now find a number of examples of how these dimensions vary by city.

    But the reality is that cars do keep getting bigger — at least in this part of the world. In the 1970s, SUVs and trucks made up less than a quarter of new car sales in the US. Today, this number is greater than 80%. It has become the standard kind of car.

    So this week, let’s touch on why this has happened.

    One argument might be that this was just what consumers inherently wanted. But there’s lots of evidence to suggest that this wasn’t really the case; it was instead encouraged by government policy.

    One specific example is the creation of Corporate Average Fuel Economy standards (also known as CAFE). This was first introduced in the 1970s, but importantly, it was done with two different fuel economy standards: one for cars and one for light trucks.

    Since the light truck standard was less onerous (see above chart), this created a strong incentive for car makers to just make and sell more light trucks. And curiously enough, that’s exactly what they did.

    For much more on this topic, check out this comprehensive Vox article by David Zipper.

  • Three ways to optimize investments in transit

    Sometimes I’ll hear people in Toronto talk pejoratively about all of the development that’s been happening at Yonge & Eglinton (in midtown). They’ll say it’s too much density.

    But then you come across charts like the ones above (source previously shared here) and you realize that this location is the only section along the new Eglinton Crosstown LRT line that is actually starting to have enough people.

    Based on 2021 Census data, there were about 40k people within 800m of the future Eglinton and Mount Pleasant stations. In contrast, there are many downtown stations along the Ontario Line (also under construction) with around 80k people.

    Why this is important is because if the objective is to get people to ride this new transit and collect a lot of fares, then the single most important factor is going to be the amount of people that live, work, and play adjacent to each station.

    Now, I’m not a transportation planner, but in my mind there are three simple ways to think and go about optimizing for this:

    1. You can look at where population densities are already high and then add new transit to service these densities. This is what is happening with the Ontario Line and it was long overdue. We know that ridership is going to be relatively high because of the chart at the top of this post.
    2. You can look at where there’s existing transit and then work to optimize the land uses around it. This is what we should be doing a better job of along the Bloor-Danforth line, where certain station areas have actually lost people over the last few decades. This is the opposite of what you want next to transit investments.
    3. Lastly, you can also proactively plan new transit while simultaneously encouraging more density. An example of this would be the Vaughan Metropolitan Centre (just north of Toronto). Extend the line and encourage growth. This is good. The only thing with this approach is that it can seem a bit misaligned if you’re currently failing at #1 and #2.

  • Walking back a transit decision

    I take the UP Express train into the office every day (here in Toronto). This is a rail service that we have spoken about many times over the years on this blog.

    It started as an airport link that was too expensive, but was then repriced so that more people would use it, and use it locally. It is now widely used by people like me. I don’t know the exact split, but in the mornings, it feels like majority commuters.

    Then on Monday of this week, the province announced that local service would be reduced from every 15 minutes to every 30 minutes. Supposedly this was in order to improve service between downtown and Pearson airport.

    Commuters immediately reacted. In fact, while riding the train on Tuesday morning, there was quite literally a guy beside me on the phone trying to complain to his local city councillor and MPP. A petition was also started on Monday that, at the time of writing this post, had close to 6,000 supporters.

    And then — some 24 hours after the initial announcement — the Minister of Transportation announced that the province would be walking back this service change and that he had “directed Metrolinx to not proceed.” Boom.

    As a daily rider, this selfishly makes me happy. But more importantly, I think it, once again, shows how quickly voices can get amplified in today’s world and how important good regional express rail is to our city. Clearly we need more of this!

    Sadly, it probably also shows that some people have no idea how lines like these are actually getting used. I have to believe that if anyone had looked closely at ridership and the split between local/airport, that this decision wouldn’t have been made in the first place.

  • 25 years of transit-oriented development

    When we build next to transit, we often call this transit-oriented development. 

    What’s interesting about this moniker is that it implies we’re doing something a little special — something out of the ordinary. And I guess that makes sense because, in many cities, it is often out of the ordinary. 

    That’s why you don’t hear people at real estate conferences saying, “check out this new cutting edge car-oriented development that our firm is developing.” That doesn’t need to be specified.

    But at the end of the day, I’m not sure how special transit-oriented development really is; it’s basically just urban development. Meaning, you put density on top of and next to transit stations and then more people take transit. That’s how this works.

    On that note, here is an interesting study from the School of Cities that looked at Toronto’s transit network and how the populations around each station have changed (or not changed) between 1996 and 2021 (census data). 

    If you look at the various transit lines, you’ll see that, in some cases, like downtown, we have added a lot of new transit-oriented development. This is good. Populations increased. 

    But in many/most other cases, populations remained flat; or worse, they declined. This is a serious problem, and it shows how land use restrictions are forcing us to underutilize our existing transit assets.

    Maybe what we need to do is stop thinking about transit-oriented development as something special, and instead remind ourselves that this is standard operating procedure. It’s just what you do next to transit.

    Thanks to Sam Kulendran for sharing the above study with me.

  • Car washes are hot right now

    We talk a lot about walkable urban communities on this blog, and I’ll be the first to admit that this is my own bias. It’s my preference. But at the same time, we can’t ignore that, as of 2022, there were nearly 280 million registered personal and commercial vehicles in the United States. And that only about 8.3% of households do not have a vehicle. Most households drive in this part of the world.

    The result is that lots of people want to regularly wash their car(s). According to Bloomberg, there are some 60,000 car washes across the US, and the overall sector has been growing at roughly 5% per year (I’m not sure over what time period). More thrilling, though, are the stats that the car wash market is expected to double by 2030 and that there were more car washes built in the last decade compared to all prior years combined.

    The obvious reason for this is that there are a lot of drivers. But why right now? Apparently, there are other more specific reasons for the recent boom in car washes:

    Now, washes can take just 90 seconds, labor costs have been automated down, and recurring revenue from memberships has eliminated weather risks. Plus, the tax reforms enacted in 2017 by former president Donald Trump allowed car wash owners to claim 100% depreciation on new equipment — a generous subsidy to further investment. While that incentive was written to shrink over time, the tax proposal currently in Congress would restore the 100% depreciation allowance.

    This has the PE and real estate industries interested:

    “If private equity thinks it’s sexy, they’re gonna throw money at it, right?” said Emil Khodorkovsky, founder and CEO of Forbix, a real estate firm that just acquired a car wash in Santa Monica, California. “It’s a basic business. It isn’t complicated finance. Certain actors are getting squeezed but this one still has a much higher-yielding return than an apartment building or a retail center.”

    It’s hard to think of a retail use that is more antithetical to walkable urban communities. Even most drive-through places have the ability to service things that aren’t cars. It is also possible to go through a drive-through on a bicycle or other micro-mobility device. I have done this before and it was fun. But going through a car wash on a bicycle is probably a lot less fun.

    Intuitively, as long as there are lots of cars, there will be lots of people who want car washes. At the same time, there may even be a more urban use case, here. If you happen to have a garage and a driveway, there is always the possibility that you could wash your own car. But if you live in a walkable urban center and you park your car in a stacker accessed via an elevator, it’s probably a lot harder for you to do that.

    In this case, there’s a subscription for that.

  • Dynamic transit pricing

    Over the years on this blog, we’ve spoken a lot about dynamic pricing when it comes to roads and traffic congestion. And in this instance, the principal intents are to price congestion, improve traffic flows, and encourage other modes of transport. It follows the logic that if you’re going to tax things, tax the things you want less of.

    But what about using dynamic pricing for the opposite purpose — to induce demand?

    Diana Lind recently wrote about this here and talked about how London is exploring using dynamic pricing on its transit system. But rather than increasing prices during periods of high demand, I would imagine that the idea is to reduce prices when demand is lower. Already, it is piloting reduced fares on Fridays when its ridership drops by about 10%.

    It’s an interesting idea because, if done correctly, it should get more bums into seats on transit. And maybe it’s actually a more equitable pricing model.

  • Traffic counts at Yonge & St. Clair since 1984

    Matt Elliott writes a newsletter called the City Hall Watcher. And one of his features is something called Intersection Inspection. It is where he does a deep dive into traffic counts and modal splits for intersections across Toronto. This week, he covered Yonge & St. Clair in midtown, and so I thought it would be interesting to share it on the blog. (Thanks to Canada Record for the tag on X.)

    Here are traffic counts for the intersection going back to 1984:

    What seems clear is that Yonge & St. Clair is fairly evenly divided between cars and pedestrians. And it has been this way going back many decades. At the same time, though, the volume of cars seems to be declining. According to the above data, cars haven’t seen a count above 20,000 since 2014. There does also seem to be a slight spike in bike usage recently (this is broken out further in Matt’s newsletter).

    Data is crucial to good city building and I don’t think it is leveraged nearly enough. For example, take the intersection of Baldwin St and Kensington Ave in Toronto’s Kensington Market. If you look at the traffic counts (which can also be found in the above newsletter), you’ll see that 88% of traffic tends to be from pedestrians (79%) and bikes (9%). Only 12% of traffic is from cars.

    With this data in hand, you might, then, ask yourself: Should Kensington Market be mostly pedestrianized? And in my opinion, this is a lot easier to answer when you have numbers in front of you telling you how humans actually occupy the area.