Daily insights for city builders, delivered every morning at 6 AM ET. I’m Brandon Donnelly — a Toronto-based real estate developer and founder of Globizen. I’ve been writing here since 2013.

Author: Brandon Donnelly

  • Become a Sidewalk Toronto Fellow

    Sidewalk Toronto is currently looking for “12 smart, creative, and caring people who are interested in the future of Toronto’s waterfront and how we [Sidewalk Toronto] can responsibly incorporate technology to improve urban life.”

    Each Fellow will complete a 2-day orientation session in Toronto; 6 days in Amsterdam and Copenhagen; 5 days in New York City and Boston; 3 days in Vancouver; and then do a final 2-day working session back in Toronto before presenting their takeaways.

    This feels like a response to the criticism that Sidewalk Toronto wasn’t doing enough to listen to the community and that it simply wanted to build a tech-infused neighborhood that could serve us more ads – but it’s cool nonetheless. 

    If you’re between 19-24 years old and you live in Toronto, you can apply here. It sounds like a fun opportunity for young city builders. I know that I certainly would have been all over it when I was in that age bracket.

  • Only 2 new single-family homes sold in Toronto last month

    Altus Group just released its January (2018) sales figures for the new home market in the Greater Toronto Area.

    – 1,251 new homes sold last month. 886 of these (or 70.8%) were condominium apartments (everything from stacked townhouses to high-rises).

    – This is down from 2,429 homes in 2017 and 2,118 homes in 2016.

    – Almost half of the new home sales (609 homes) came from Toronto alone. And almost all of these (607 homes) were condominium apartments. Only 2 new single-family homes sold in the city last month.

    – Benchmark price for single-family homes was $1,229,454, which is a 19.6% increase from January 2017.

    – Benchmark price for condominium apartments was $714,430, which is a 40.8% increase from January 2017.

    That last increase really stands out. I did a double take.

    But as we’ve talked about before, low supply and high prices seem to be pushing more buyers toward condos – and larger ones at that.

    Recently we’ve been seeing an increase in both average unit sizes and prices per square foot.

    According to Altus, sales of new single-family homes in the GTA last month were the lowest for a January since before 2000.

  • Global mobility index

    Below is a short video that was created by the MIT Senseable City Lab, World Economic Forum and TomTom for a study on how people move in 100 cities around the world. They call it the Global Mobility Index.

    It shows congestion levels (using real-time traffic data from TomTom), commute times, and an estimate for the percentage of trips that could be shared if people were willing to wait up to 5 minutes.

    In the case of Toronto, they estimate that 99% of trips could be shared and that it would increase average speeds by ~7.9 km/h and reduce overall traffic levels by ~44.09%.

    Their solution to solving traffic congestion is a cocktail that involves car-sharing, bike-sharing, and public transit. It’s about developing a “mobility portfolio.” Seems sensible.

    I found myself wanting more information and data after watching the video. Still, it was interesting to see what the authors describe as the “pulse of our cities.”

    If you can’t see it below, click here.

    [youtube https://www.youtube.com/watch?v=ciJEHGMtpWc?rel=0&w=560&h=315]

  • Drinking on the street and the 2018 index of economic freedom

    This morning I was reading a snippet about Hong Kong changing its drinking laws in order to curb “Club 7-Eleven” and it made mention of the “country” being the freest economy in the world according to the Heritage Foundation.

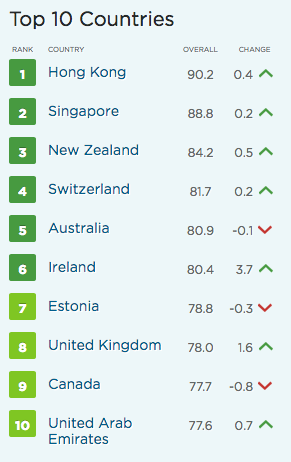
    I was immediately curious and so I looked up their 2018 Index of Economic Freedom. Below are the top 10 countries. Apparently Hong Kong has been #1 for the last 24 consecutive years.

    The Heritage Foundation describes economic freedom as “the fundamental right of every human to control his or her own labor and property.” 

    And to measure this they look at 12 aspects of economic freedom, which are grouped into the following 4 categories: rule of law; government size; regulatory efficiency; and market openness.

    If you’re really keen, there’s also this free book that was published alongside the 2018 index. But come to think of it, this index appears to have very little to do with lax alcohol laws.

  • Attract and extract

    Chris Dixon’s recent piece on why decentralization matters is currently making the rounds online. It clearly explains the first two eras of the internet and how the third era is developing as we speak. Cue decentralized cryptonetworks.

    I particularly like how he describes the relationship that centralized platforms – like Facebook – have to their users and to their complements (other businesses, software developers, creators, and so on). 

    Here are two graphs from his article:

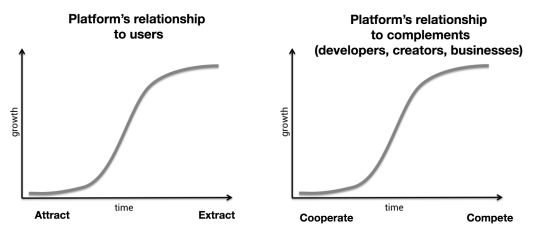
    In the early days it’s all about cooperation and doing everything you can to attract users. The platform gets more valuable the more users are on it and so the immediate goal is to build up the network effects and lock people in.

    But as the platform grows, the relationship flips (top of the S-curve). In Dixon’s words, it becomes a zero-sum game whereby to continue growing the platform starts extracting data from its users and competing with its complements.

    The promise of cryptonetworks is that they will do away with many of these negative externalities, but at the same time empower the kind of sophistication that we see today with centralized platforms.

    The venture capitalists are circling because a fundamental shift in the architecture of the internet will mean disruption. I’m following it because I want to understand how it may apply to real estate and the built environment.

  • Is it only a matter of time before Amazon enters the delivery business?

    Yesterday I ordered something from Amazon Prime. The guaranteed delivery time was today before 9pm, but within an hour of ordering the delivery estimate was updated and it ended up arriving on the same day about 5 hours after my order. I thought this was pretty amazing, particularly because the package was a bit time sensitive.

    Delivering to individual residences is more expensive than delivering to more centralized businesses and stores. And with the rise of online shopping, UPS now delivers as many as 31 million packages every day. Because of this, every little detail counts. 

    Last year the company started installing Bluetooth receivers on the inside of its delivery trucks. If a driver incorrectly loads a package that isn’t on their route, it pushes out a loud beep. (This is one of the many tech and data-driven projects that UPS is working on to ensure it stays competitive.)

    Previously there was no final check. If there was a rogue package on the truck, it meant the driver would have to stray from their route, coordinate a handoff, or delay the package for another day. These mishaps can really add up when you’re delivering 31 million packages in a single day.

    With Amazon squeezing delivery times and with the rumors that it’s going to start its own delivery business (to compete directly with UPS and FedEx), one has to wonder about the impact that these volumes will have on our cities. Perhaps autonomous vehicles will really become the new roaming retail outlet – ready to deliver as soon as we click buy.

  • Cities are the destinations

    image

    Resonance Consulting out of Vancouver has a new report out: 2018 Future of Millennial Travel. You can download a free copy here. Resonance does great work and really gets content marketing.

    The first chapter immediately caught my attention, perhaps because it’s called, Cities are the Destinations. It talks about how big cities as a travel destination are a highly underreported tourism metric. Historically it’s been all about beach vacations and escaping.

    According to their survey, Millennials (aged 20 to 36 years old as of March 16, 2017) are almost as likely to travel to a major city (38%) as they are to travel to a beach resort (40%) in the next 24 months. (I wonder where the mountains fit in.)

    Also interesting is that this number increases when household earnings increase beyond $100,000. This subset of respondents is most likely to visit a major city on their next vacation (40%). It’s all about new experiences.

    I’m not an expert on travel and tourism, but Resonance is calling this a sea change and a likely indicator that, in the near future, big cities will become the dominant travel destination. Is your city ready?

    Photo by Nathan Ziemanski on Unsplash

  • Jets and real estate

    Jackson Hole Airport (JAC) has one runway. It is 6,300 feet long by 150 feet wide and it was originally constructed in 1959. In 1965, the first of many proposals was put forward to lengthen the runway to 8,000 feet so that jets could fly into the airport. But it was never adopted. Subsequent proposals were made in 1992 and 1999, but they were again highly contentious and similarly never adopted. The runway remains 6,300 feet long.

    However in the early 1980s jets began using the existing runway and the area started to boom. According to this old New York Times article from 2002, the town’s growth exactly parallels the introduction of jet service at JAC. The town doubled from 9,000 people in 1980 to 18,000 people in 2000. Its per capita income also shot up from a steady $20,000 in 1984 to more than $67,000 in 2011 – making Teton County one of the richest in the US.

    Tourism destinations and second home markets like Jackson Hole are heavily dependent on access. In 2003, a total of 211,788 passengers flew through JAC airport and, in 2016, it was over 340,000 people. But second home markets are also the first to get hit during macroeconomics shocks. Following the 2008 financial crisis, passenger volumes at JAC didn’t recover until 2014.

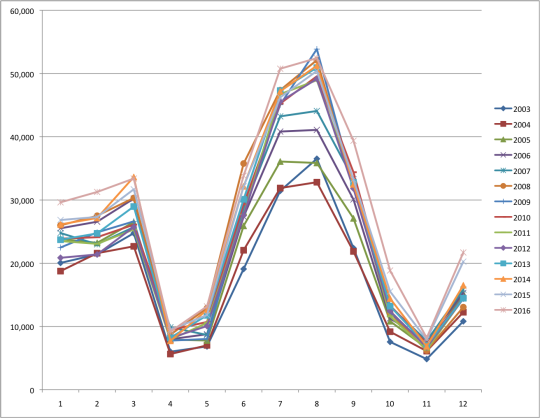
    If you look at air traffic throughout the year you’ll also see that it is highly seasonal. Below is a chart showing monthly passenger volumes at JAC from 2003 to 2016 (data from the Bureau of Transportation Statistics). Some of you may be surprised to see that more people visit Jackson Hole in the summer, compared to the winter. But what’s perhaps even more conspicuous is the sharp drop off during the swing seasons.
    image

    I am thinking about all of this not only because I just got back from Jackson Hole, but also because I am very interested in the demand drivers that fuel the real estate in many of these mountain towns. It’s easy to get it wrong. Unlike major urban centers – which often operate under a perpetual supply deficit – you can’t just build and necessarily expect people to come.

    Revelstoke Mountain Resort, for instance, first opened in 2007 with grand aspirations of building one of the largest ski resorts in North America. But they got crushed in 2008 and have never fully recovered – at least relative to their original plans. Maybe the answer is a bigger airport.

  • ULI Hines Student Competition comes to Toronto

    I was speaking with a Penn (my alma mater) student this evening about career options in development and he mentioned to me that he recently participated in the 2018 ULI Hines Student Competition. He also mentioned that this year’s “study site” is in Toronto. (It’s the BMW Toronto dealership between the West Don Lands and East Harbor.)

    For those of you unfamiliar with the ULI Hines Competition, it’s an annual student competition (now in its 16th year) that encourages collaboration among “future real estate developers and the many allied professions, such as architecture, landscape architecture, historic preservation, engineering, finance, and others.” 

    Each year there is a real life study site and multi-disciplinary teams compete for $50,000. I participated in my 2nd year of graduate architecture school and we received honorable mention. So no $50,000, sadly. But it was a valuable experience and I would recommend it to any student who plans to be involved in the built environment after graduation.

    I am looking forward to seeing what the finalists come up with for this site. I think that the study site being in Toronto – and in particular this location – speaks to the momentum that has developed in this part of the city as a result of the West Don Lands, East Harbor, Sidewalk Toronto, and the various planned infrastructure investments. 

    Here is a copy of this year’s briefing materials.
    Good luck to all of the teams that participated.

  • Manhattan apartment rents post biggest decline since 2011

    A friend of mine sent me this article earlier today with a sarcastic comment about the relationship between housing supply and rents.

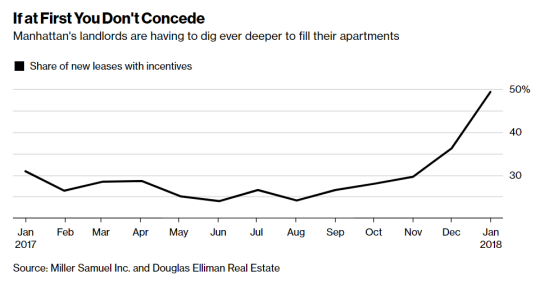
    The article talks about how rents in almost every Manhattan neighborhood have fallen compared to a year ago because of a flood of new apartment supply coming online. The median rent dropped 3.6% (year-over-year) which is the biggest decline since October 2011.

    image

    There has also been a spike in the number of leases with some sort of incentive attached to it (see above). As a landlord you typically want to use incentives, such as free rent, before resorting to lower face rents. Because lower rents mean a lower overall net operating income, which in turns depresses the value of your property.

    But sometimes you have no choice:

    “Landlords have finally realized, ‘OK, we have to adjust these prices because the concessions aren’t doing as much,’” said Hal Gavzie, who oversees leasing for Douglas Elliman. “Customers are looking past the concessions being offered and just looking for the best deals they can find.”

    A few weeks ago I wrote about a similar story playing out in Seattle. It’s almost as if excess housing supply is driving down rents.