Daily insights for city builders, delivered every morning at 6 AM ET. I’m Brandon Donnelly — a Toronto-based real estate developer and founder of Globizen. I’ve been writing here since 2013.
I just came across this post by Paul Graham called, “modeling a wealth tax.” It’s from last year, but it recently resurfaced. In it, he paints a scenario. Let’s say you’re a successful entrepreneur in your twenties (i.e. you make some money) and then you live for another 60 years. How much of your stock would the government take with various wealth taxes?
With a 1% wealth tax, it means that you would get to keep 99% of your stock each year. But assuming the wealth tax gets applied every year, you would be left with 0.99^60, which equals 0.547. Put more simply, a 1% wealth tax would mean that over the course of the 60 years after you built your company, you would be giving the government 45% of your stock.
How did this number get so big?
The reason wealth taxes have such dramatic effects is that they’re applied over and over to the same money. Income tax happens every year, but only to that year’s income. Whereas if you live for 60 years after acquiring some asset, a wealth tax will tax that same asset 60 times. A wealth tax compounds.
Of course, Paul also points out that giving away a portion of your assets each year doesn’t necessarily mean that you’re becoming net poorer, so long as your assets are increasing in value by more than the wealth tax rate.
Still, these are massive numbers. A 2% wealth tax would translate, over this same 60 year time period, into the government taking 70% of your stock. A 5% wealth tax works out to 95%. For more on this, check out Paul Graham’s post.
Global household wealth is currently estimated at about $360 trillion, according to Credit Suisse’s 2019 Global Wealth Report. This represents an increase of about $9 trillion (~2.6%) from 2018-2019.
Over the last decade, much of this growth in household wealth has come from two countries: the United States and China. 40% of the world’s US dollar millionaires reside in the United States, and China now has the second highest number of dollar millionaires. (If there are any curious Canadians reading this, Canada represents 3% of the world’s total.)
The number of ultra-high-net-worth individuals — individuals with a net worth greater than $50 million — exhibits a similar pecking order. The US is by far the most dominant.
Of course, dollar millionaires represent a small percentage of the world’s total population. Credit Suisse estimates that there are about 5.1 billion adults in the world. About 56.6% have a net worth under $10,000 and about 0.9% (okay, 1%) are millionaires. This 1% controls/owns about 44% of global wealth. Thinking back to figure 7 (above), consider this math: 50% of the world’s millionaires are now in the US and China.
Fluctuations do happen, however. Australia lost some 124,000 millionaires last year largely because of a (-6%) drop in home prices, which tends to correlate pretty closely to the real asset part of household balance sheets. Australia shed about $443 billion in household wealth since 2018, making it the biggest loser in Credit Suisse’s report.
The other thing that you may find interesting from this report is the wealth/GDP ratio that they use. Household wealth and GDP tend to correlate. But the ratio of wealth to GDP also has a tendency to increase as a country develops. This makes sense because things like the rule of law and access to capital tend to increase people’s willingness to invest/borrow. But in developed countries, it could also be a signal for asset inflation.
If you’d like to download a PDF of the full wealth report, click here.
Note: Credit Suisse’s definition of household wealth is your typical net worth calculation: assets (financial assets and real assets) minus liabilities. For most people, the real asset part is principally housing.
Bloomberg recently came up with a new index to define the distribution of wealth across adults in the world. They’re calling it your “net worth number” and the scale ranges from -2 to 11. Sadly, because the gap is so significant between the rich and the poor, it is based on a logarithmic or non-linear scale. Here’s how they break it down:
Logarithms of negative numbers aren’t a thing, and so, technically, if your liabilities exceed your assets (i.e. you have a negative net worth) you shouldn’t appear on this index. But Bloomberg has added those people — which could be students with debt, after all — into the -2 category of their scale. These are people with a penny to their name.
Now, the number of adults in each bracket is purely an estimate. If you look at different sources, you will end up with different numbers. Bloomberg believes that there are 2,800 adult billionaires in the world (numbers 9 to 11); whereas Credit Suisse’s estimate is about 1,600. (I wonder if it’s easier to estimate the number of billionaires or the number of -2’s.)
Still, it is eye-opening to see where most adults sit (at number 3) and how bottom heavy this index is.
How many of you say this? I say this all the time, even though I am trying to resist and come up with more creative responses.
I recently tweeted this idea out and then my friend Brad sent me this article from HBR: Why Americans Are So Impressed by Busyness. It’s a fascinating topic because, historically, not being busy was a sign of status. It meant you had enough money to not have to do anything.
But things have changed – at least in this part of the world. (Italy doesn’t seem to feel the same way based on some studies.) Here’s a snippet from the article:
“What has changed so dramatically in one century? We think that the shift from leisure-as-status to busyness-as-status may be linked to the development of knowledge-intensive economies. In such economies, individuals who possess the human capital characteristics that employers or clients value (e.g., competence and ambition) are expected to be in high demand and short supply on the job market. Thus, by telling others that we are busy and working all the time, we are implicitly suggesting that we are sought after, which enhances our perceived status.”
So the reality is that there’s actually a good reason for always talking about how busy we are. But as Silvia Bellezza points out in her article, there are also physiological consequences to always being: “busy!”
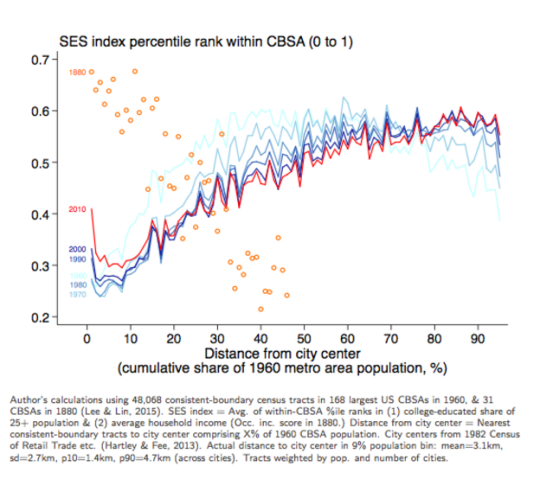
The chart compares the socioeconomic status in US cities (y-axis) against “distance from city center” (x-axis) in 1880 and then in recent years (1960 to 2010 census data). The orange circles represent the 1880 data and the red and blue lines represent the recent census data.
What this chart and research tells us is that in 1880, rich people overwhelmingly lived in the center of cities. And as you moved further away from the city center, socioeconomic status fell off pretty precipitously. This makes sense given that, at the time, it was hard to get around and travel long distances.
However, in the post-war years, the exact opposite became true. We began driving and wealth decentralized. This should surprise no one.
But what’s interesting is how this appears to be reversing. In 2010 (the red line), there’s a sharp increase in socioeconomic status for people living basically right in the center of cities. And for the 30 – 60 km range, there has been a decrease in socioeconomic status essentially from the 1960s onwards.
The important takeaway here – which is spelled out in the Washington Post article – is that the neighborhoods which appear to be in high demand today are also in very short supply:
“We have 80 years of essentially zero production of neighborhoods with these qualities,” Grant says. “We’ve spent the last 80 years building car-oriented suburbs. Then when the elites decide they want to go back into the city, there’s not enough city to go around.”
The focus of the article is on inequality; capitalism vs. socialism; Thomas Piketty’s book, Capital in the Twenty-First Century (which is now on my reading list); and on how Modernism lost its social mission and got repurposed as a tool that just serves capitalist interests. It went from an ideology to simply an architectural style.
Here is an excerpt:
“Once discovered as a form of capital, there is no choice for buildings but to operate according to the logic of capital. In that sense there may ultimately be no such thing as Modern or Postmodern architecture, but simply architecture before and after its annexation by capital.”
Given that I am initially trained as an architect, but that I work as a real estate developer, this article hits home for me. But unlike the author, I am not as fussed by this intertwining of capital and architecture. In fact, I have always believed that the more architecture can understand its economic milieu, the more likely it can affect positive change.
Of course, there’s the question of whether that economic milieu is even the right one in the first place. I’ll echo this blog post (on the limits of capitalism), by saying that I consider myself a capitalist, but not an absolute capitalist. Capitalism isn’t perfect.
I like Reinier’s description of income vs. wealth (borrowed from Piketty):
He identifies two basic economic categories: income and wealth. He then proceeds to define social (in)equality as a function of the relation between the two over time, concluding that as soon as the return on wealth exceeds the return on labour, social inequality inevitably increases. Those who acquire wealth through work fall ever further behind those who accumulate wealth simply by owning it.
Throughout history, real estate has been a tremendous source of wealth for a lot of people. Many family dynasties were created by accumulating property, holding it, and then riding the valuation wave.
Here in Toronto, there was the Reichmann family. At one point they had created the largest real estate company in the world (Olympia & York). But I’m not sure exactly how much of that wealth remains today following the company’s bankruptcy in the early 90s. That was a tough time in Toronto real estate.
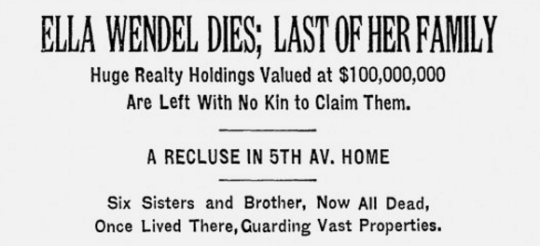
In line with this, the NY Times recently published a fascinating account of the Wendel family in New York. In terms of how they conducted themselves, they were the polar opposite of some of today’s real estate families (i.e. Trump), but they certainly built an empire.
Here are two snippets from the NY Times:
In the early 20th century, the Wendels were perhaps the most powerful landlords in New York City, a dynasty with more than 150 properties in Manhattan worth over $1 billion in today’s dollars. The Wendels were the delight of the local papers, for, rich as they were, the family — six sisters and a brother, all unmarried — lived together in a shuttered mansion without electricity on the northwest corner of Fifth Avenue and 39th Street, and dressed in grim Victorian garb that had gone out of style half a century earlier. Tour buses regularly pulled up in front of “the House of Mystery.”
Alongside their austere lives, they also practiced a strict and disciplined approach to investing:
Never mortgage a property; never sell anything; never pay for repairs; and never forget that Broadway moves uptown at a rate of 10 blocks a decade.
In fact, they were so draconian in their approach, that the sisters were supposedly prohibited from marrying. Unions were not allowed because that, according to the NY Times, “would disperse the accumulated property and put it under other names than Wendel.”
But in the end, this meant that the last Wendel – Ella, who died in 1931 – died alone and with no one to pass along the empire to. So instead it was distributed to various charities and the inevitable “cousins” that come out of the woodwork when a rich person passes.
I guess the moral of the story here is the old saying that you have to “give to receive.” From the sounds of it, the Wendel family didn’t like to do that.
Every year the London-based property consultancy Knight Frank publishes something called The Wealth Report. And it’s one of those reports that I could go through for hours.
It includes a ton of really fascinating stats that speak volumes about where in the world wealth is being created and how it’s moving around. And of course there are a lot of connections between wealth, real estate, and city building.
Below are 3 diagrams that really stood out for me in the 2015 version.
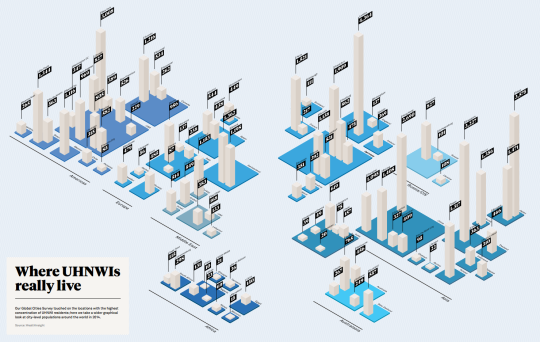
The first diagram shows which cities have the most Ultra High Net Worth Individuals (UHNWIs). An UHNWI is defined as an individual with assets exceeding US$30 million, but excluding personal assets and property (such as one’s principal residence). Click here to see the full size image (I know the numbers are small).
Not surprisingly, London (4,364), Tokyo (3,575), Singapore (3,227), New York (3,008), and Hong Kong (2,690) are at the top of the list. But I was a little surprised – albeit happily surprised – to see Toronto (1,216) come in at #2 in North America, beating out Mexico City (1,116), Los Angeles (969), and Chicago (827).
The second diagram shows you how many square meters of luxury property (apartment) you can buy for US$1 million in a bunch of different cities around the world.
In Monaco (top end), that’ll buy you 17 square meters (183 square feet) and in Cape Town (bottom end), that’ll buy you 208 square meters (2,196 square feet).
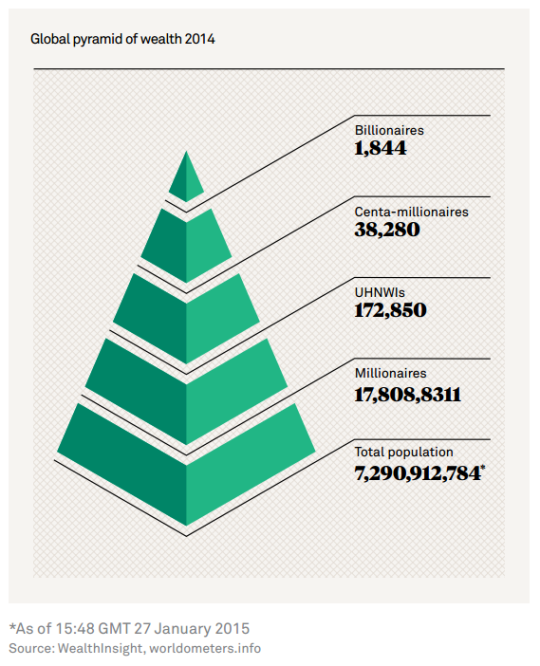
The third and last diagram is what they call the global pyramid of wealth. It’s a pyramid of everyone in the world and then the number of millionaires, UHNWIs (see above), centa-millionaires, and billionaires. And if you do the math, the top of this pyramid comes nowhere close to 1% of the global population.
It’s fascinating (and exciting) to see where and how global wealth is concentrating. But it should also make you think about rising income inequality. I know it does for me.
This blog post is a submission to a group blogging event being put on by Meeting of the Minds and Living Cities. The focus is on urban opportunity. Click here for more information about the event.
Since the beginning of time, the purpose of cities has been to bring people together to socialize with one another and to generate wealth. And, today, more than ever, the potential returns of being smart and being in a global city are huge. Cities are our economic unit. They are what’s driving the global economy.
But as the world continues to urbanize at an unprecedented rate and as the global economy becomes increasingly concentrated in select urban centers, how do we ensure that all city dwellers are connected to the economic opportunities being made available by this new information age?
Here are 3 suggestions.
First, we need broad and equitable access to education. I was deliberate in talking about the “returns of being smart.” Education and the right skills are even more critical today, because the labour market is not what it used to be. In Edward Glaeser’s book, Triumph of the City, he talks a lot about Detroit and how the greatest thing the city–and the car industry–did in its history was create lots of high paying jobs for people with little or no education. However it was also possibly the worst thing Detroit did because, today, the city is now stuck with that legacy. And those same high paying jobs for people with little or no education aren’t coming back. The labour market has changed.
Second, we need to ensure that people living in cities have the opportunity to be physically connected. That our cities offer strong transportation and mobility options and that our cities are designed to be inclusive. When I was visiting a friend in Los Angeles a few years ago and lamenting about the traffic, he responded by telling me that LA traffic is merely a socioeconomic problem. If you have the means, you get to live in desirable central neighborhoods where your commute is entirely reasonable. And if you don’t have the means, well, then you get stuck with a horrible 2-hour commute. We know that the rich will always outbid the poor for housing in any city, but as much as possible, we need to give people physical mobility so that they can then achieve economic mobility.
At the same time, the design of individual neighborhoods and buildings matters a great deal. If you’ve ever watched The Human Scale, you’ll likely remember the line:
“First we shape our cities and then our cities shape us.”
As one example, the documentary talks about how masterfully modernist architecture from the 60s and 70s achieved extreme forms of social isolation. It cleansed the urban environment of any sort of public life and brought it all up into disconnected towers. The problem was that it was far too rational. The power of cities lies in their organic and evolving nature. And when you constrain them with mechanisms such as single use zoning and other restrictions, you stifle their potential to generate economic opportunities for their residents–which, as we’ve said, is one of the main reasons people choose to live in cities in the first place.
Finally–and this is a bit of a tie in for everything we’ve been talking about–we need to be proactive about inequality. Research shows that there’s a direct correlation between income inequality and social mobility. The more income inequality a city or country has, the less intergenerational social mobility it has–not to mention that it also leads to more crime and other negative externalities. This is a complex issue though, and I won’t pretend that it can be easily solved with a better public transit and more bike lines. It’s something much deeper and more broad. This one is about a belief that cities should be designed to enhance everybody’s quality of life and to make everybody richer, not just a few.
James Frank Dy Zarsadiaz (a Ph.D. candidate at Northwestern) published an article in Atlantic Cities a few days ago called, “Why gentrification is so hard to stop.”
In it, he essentially talks about how neo-liberalism has allowed private interest to trump public good and how it has dramatically changed cities and the expectations of its residents:
“…those who can afford to live in a city now expect a personalized, “just for you” urban lifestyle. For-profit companies chase these urbanites with upscale housing and creative marketing campaigns, transforming blighted and blue-collar neighborhoods into “livable” urban nooks.”
Now, as a developer I know I’m biased here, but is gentrification really as evil as he makes it out to be?
“I’ve always maintained that gentrification is what occurs when demand exceeds supply and blight is what occurs when supply exceeds demand.”
I like it because it’s a simple way of saying that what we are seeing is a natural market outcome. What’s wrong with somebody wanting to buy a house in a marginal area and fix it up? Can we reasonably expect to stop people from doing this so that wealth never increases within a neighborhood?
The bigger issue, in my view, is rising income inequality. We know that this is becoming more and more of an issue. The benefits to being smart and educated today are huge. So how do we ensure that we’re not creating a society of haves and have-nots?
Let’s figure this out and let people buy whatever homes they want.