Daily insights for city builders, delivered every morning at 6 AM ET. I’m Brandon Donnelly — a Toronto-based real estate developer and founder of Globizen. I’ve been writing here since 2013.

Tag: wealth report

  • Dubai is now the top “super-prime” residential market

    People continue to buy expensive homes:

    Global super-prime ($10m+) residential sales bounced back in Q1 2023, with 417 sales across the 12 markets tracked in Knight Frank’s new Global Super-Prime Intelligence report. That’s up 11% on the 376 recorded in Q4 2022 and the highest volume since Q2 last year.

    The biggest market in Q1 this year was Dubai (88 sales), followed by Hong Kong (67), New York (58), Los Angeles (46), Singapore (37) and London (36). While volumes rose in Q1, the total value of sales fell 4% to $7.2 billion. The most expensive average super-prime sales took place in Geneva ($23.8m) and London ($20.4m)

    What is perhaps most interesting, though, is how central Dubai has become in the flows of global capital. In 2019, Dubai accounted for 2% of all super-prime sales in the 12 markets that Knight Frank tracks.

    Today, looking back at the most recent 12-month period, Dubai now accounts for 17% of all super-prime sales, placing it ahead of London, New York, and Los Angeles.

    Part of this jump likely has something to do with the “housing disaster” that Dubai was going through back in 2019. But even still, it is impressive to see just how quickly the city has managed to build and position itself as an alpha global city.

    I much prefer walkable cities, but clearly there are enough other people who don’t care about that sort of thing.

  • Wealthiest cities in the world

    According to this annual survey by Henley & Partners (first chart from Bloomberg), these are the top 10 wealthiest cities in the world when you count the number of high-net-worth individuals (i.e. people with investable wealth greater than US$1 million):

    However, if you instead count billionaires, the top city flips from New York City to the Bay Area (which includes San Francisco and all of Silicon Valley). This isn’t all that surprising.

    Also not surprising is the precipitous decline in the number of HNWIs residing in Hong Kong. From 2012 to 2022, the number declined by 27%. That said, a bunch of other cities fared even worse. The city that lost the most millionaires over this same decade was Moscow. It declined by 44%.

    For those of you wondering about Toronto, we placed 12th, just after Chicago, with 105,200 millionaires, 193 centi-millionaires, and 18 billionaires:

    The next city in Canada on the list is Vancouver, and following that is Montreal:

    It is interesting to see how much further behind Montreal places with these metrics given that it is an urban region with about 1.6x the population of that of Vancouver’s.

    Also interesting — given its size and global importance — is Paris (18th when it comes to HNWIs):

    However, when it comes to seasonal draw, Paris is second only to Miami, which appears to be the undisputed global destination for rich people in the winter. Paris has 126 centi-millionaire residents, but during its peak holiday month (presumably summer), this number is believed to increase to over 300:

    Finally, looking at Park City, Utah, it has 8 permanent centi-millionaires and this number is thought to increase to over 100 during the winter snowboarding season. And to be clear, this transient population figure only includes people who own a second home there. It does not include rich people paying US$3,700 per night to stay at Deer Valley. That’s pretty good for a small town of only 8,500 permanent residents.

    To check out the full list of 97 cities, click here.

  • The world’s top performing luxury residential markets

    Knight Frank just released the 16th edition of its Wealth Report along with the disclaimer that, with everything going on in Ukraine right now, this outlook is of “little relative importance” and kind of doesn’t matter in the grand scheme of things. In any event, it includes the latest edition of their Prime International Residential Index (PIRI 100), which looks at the annual % change in luxury residential prices around the world. The chart is interactive, but I screenshotted (above) the top risers and fallers. Toronto is 4th in the Americas and 7th globally with a 20.3% year-over-year increase. Miami is also no surprise and came in 4th globally. The top three cities were Dubai, Moscow, and San Diego. Thankfully though, the number two city is in serious jeopardy right now and I suspect that its position will look quite different next year. Money will go where it feels safe and secure.

  • London super prime and the City Trifecta Index

    The latest (15th) edition of Knight Frank’s annual The Wealth Report was published last month. I find these interesting because they give you a global view of how and where capital is flowing into real estate (specifically prime real estate). London, for example, did rather well last year despite the pandemic. Buyers from the around the world spent nearly $4 billion on what is commonly referred to as “super-prime properties.” This is real estate with a sale price of US$10 million or more. London saw 201 super-prime properties trade hands last year, with an average price of $18.6 million and with 31 of these transactions being at or above $25 million. This is an increase compared to the year prior (2019), which I suppose is something given that the UK’s housing market was more or less frozen between March and May of last year. These figures put London at the top, ahead of New York and Hong Kong, when it comes to super-prime real estate sales in 2020. (London figures via the Financial Times.)

    Another interesting thing that you’ll find in the report is a city ranking that Knight Frank calls their City Trifecta. What this index does is take Knight Frank’s City Wealth Index (which considers where wealth is currently concentrated) and then adds in two other dimensions: innovation and wellbeing. The idea here is that innovation should drive future economic growth and wealth, and that wellbeing (quality of life) is pretty important when it comes to the future competitiveness of our global cities. When you look at the world’s top cities through this lens, the ranking starts to differ from what you may be used to seeing with cities like London, New York, and Hong Kong at the top (see above chart). Now you have Munich taking the number one spot; Boston and Toronto in 5th and 6th position, respectively; and cities like Zurich jumping up ahead of cities like Hong Kong. These kind of rankings always need to be looked at with a critical eye, but they can be interesting nonetheless.

    Image: Knight Frank

  • Prime residential pricing in 10 global cities

    The below graphs are taken from a recent (June 2019) report by Knight Frank on “prime” residential pricing across the world. They define “prime” as generally being the top 5% of each market by value. What these graphs show are the spread between the average price of a prime property and the top price achieved in that market.

    The most expensive market is Hong Kong. The average price of a prime property in 2018 was USD 4,251 per square foot (or USD 45,760 per square meter) and the top price achieved was in 2016 at USD 28,154 per square foot (or USD 303,051 per square meter).

    Using the 2018 average, a 350 square foot studio apartment would run nearly USD 1.5 million (or almost CAD 2 million), assuming there are “prime” studios available in the market. Remember, we are talking about the top end of the market.

    If you’d like to download a copy of the full report, you can do that over here.

  • The global pyramid of wealth

    Every year the London-based property consultancy Knight Frank publishes something called The Wealth Report. And it’s one of those reports that I could go through for hours. 

    It includes a ton of really fascinating stats that speak volumes about where in the world wealth is being created and how it’s moving around. And of course there are a lot of connections between wealth, real estate, and city building.

    Below are 3 diagrams that really stood out for me in the 2015 version. 

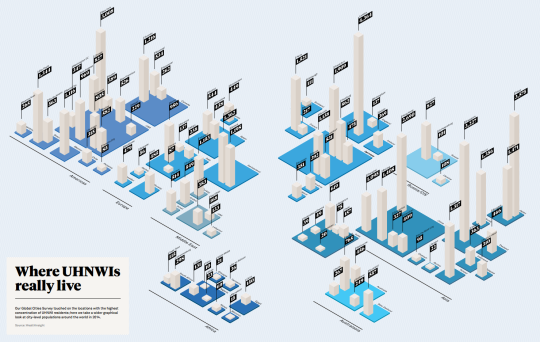
    The first diagram shows which cities have the most Ultra High Net Worth Individuals (UHNWIs). An UHNWI is defined as an individual with assets exceeding US$30 million, but excluding personal assets and property (such as one’s principal residence). Click here to see the full size image (I know the numbers are small).

    image

    Not surprisingly, London (4,364), Tokyo (3,575), Singapore (3,227), New York (3,008), and Hong Kong (2,690) are at the top of the list. But I was a little surprised – albeit happily surprised – to see Toronto (1,216) come in at #2 in North America, beating out Mexico City (1,116), Los Angeles (969), and Chicago (827). 

    The second diagram shows you how many square meters of luxury property (apartment) you can buy for US$1 million in a bunch of different cities around the world. 

    In Monaco (top end), that’ll buy you 17 square meters (183 square feet) and in Cape Town (bottom end), that’ll buy you 208 square meters (2,196 square feet).

    image

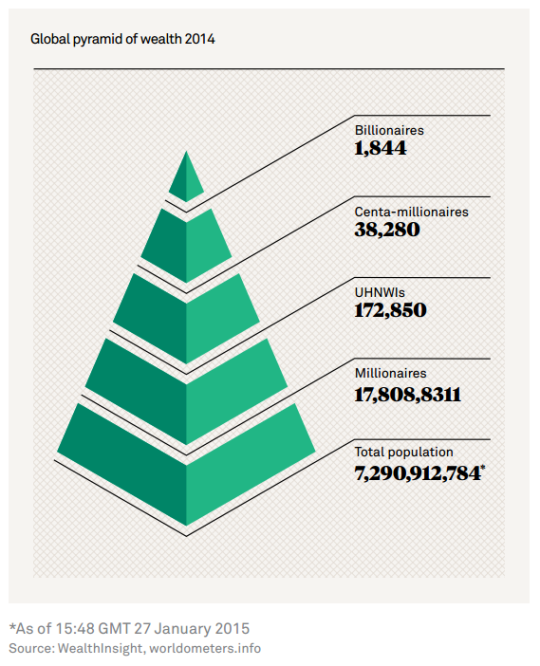
    The third and last diagram is what they call the global pyramid of wealth. It’s a pyramid of everyone in the world and then the number of millionaires, UHNWIs (see above), centa-millionaires, and billionaires. And if you do the math, the top of this pyramid comes nowhere close to 1% of the global population.

    image

    It’s fascinating (and exciting) to see where and how global wealth is concentrating. But it should also make you think about rising income inequality. I know it does for me.