Daily insights for city builders, delivered every morning at 6 AM ET. I’m Brandon Donnelly — a Toronto-based real estate developer and founder of Globizen. I’ve been writing here since 2013.

Tag: washington post

  • Climate lessons from 16th century England

    We don’t like coal today, but it certainly transformed Victorian-era architecture:

    “It is the biggest transition in the history of our species, with the possible exception of starting to use fire at all in the first place,” says Barnabas Calder, author of the groundbreaking study “Architecture: From Prehistory to Climate Emergency.” Fireplaces had to be redesigned for coal, smaller, and more efficient, and could now be distributed throughout the house, warming a sequence of smaller rooms that contained heat more efficiently. Brick, which also requires substantial amounts of energy to produce, became affordable. And glass, too, was accessible to ordinary people. “Coal affects the way you can achieve comfort conditions in a building, and it is a very affordable way of producing a significant amount of warmth, which allows for bigger windows. Even more significant is that it opens up a series of new building materials.”

    But as new technologies transformed how we thought about it architecture, they also transformed how we thought about climate. Buildings used to have to be carefully “tuned” to their local environment. You had to think about where the sun was coming in, how you were going to trap it during the winter months, and how you were going to release it during the summer months, among many other things.

    Eventually though, this stopped mattering.

    We had building systems that could take care of these matters, which then meant that we were free to aspire to build the exact same architecture in Phoenix as in London. But we now know that that this doesn’t make much sense. And this recent architectural tour from the Washington Post, which starts in 16th century England, is a good reminder that the lessons learned many centuries ago are in fact still relevant today.

    Maybe even more so.

  • New land development across the US between 2001-2019

    The Washington Post just published this interactive feature showing new developed land (i.e. urban sprawl) across the US between 2001 and 2019.

    It is based on these land cover maps which were published by the US Geological Survey earlier in the summer. Their findings show that between 2001 and 2019, more than 10% of the land cover in the lower 48 states changed during this time period. Mostly in forested areas.

    The WP feature allows you to search by city/address and I would encourage all of you to try it out. As an example, here is Salt Lake City. The gray areas represent land that was already developed in 2001. The purple areas represent land that was developed sometime between 2001 and 2019.

    Images: Washington Post

  • Urban vs. suburban home prices

    Aaron Terrazas, who is a Senior Economist at Zillow, recently gave this presentation about the US and Virginia Beach housing markets. (I discovered it through City Observatory.)

    There are a bunch of interesting graphs/stats in the presentation. Home values in Virginia Beach, for example, have yet to fully recover from the 2007-2008 financial crisis. They are still 8% below their pre-crisis peak, which was in July 2007. (I presume the presentation is dealing in nominal dollars.)

    I’ll give two more examples. 

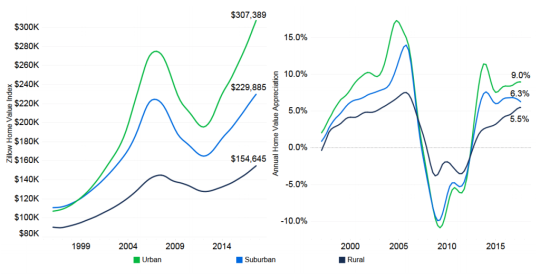
    Below is a chart comparing average home prices for rural (dark blue/purple), suburban (blue), and urban (green) homes. In the late 90′s, suburban and urban homes were roughly equal in terms of average prices. But since then, urban homes have shown greater appreciation. The spread also appears to be widening.

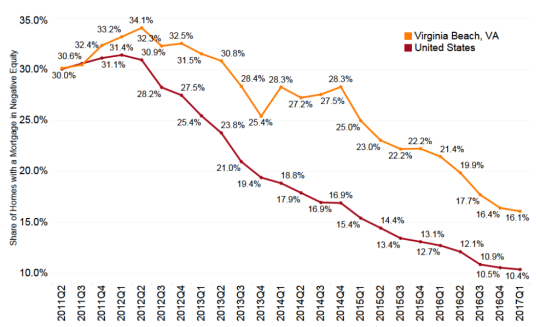
    And here is a graph showing the share of mortgage borrowers in a negative equity position. That is, the value of the home is less than the outstanding balance of the mortgage.

    Now this is only covers people who have a mortgage. According to this Washington Post article, about 34% of all US homeowners don’t have one. Either they have paid it off or they never had one.

    Still, the above numbers stood out to me. They speak to the severity of the financial crisis. At the end of 2011 and the beginning of 2012, over 30% of borrowers were in a negativity equity position. And in Virginia Beach it was more than 1/3 of all borrowers at the peak.

    For the full presentation, click here.

  • The urban wealth pendulum

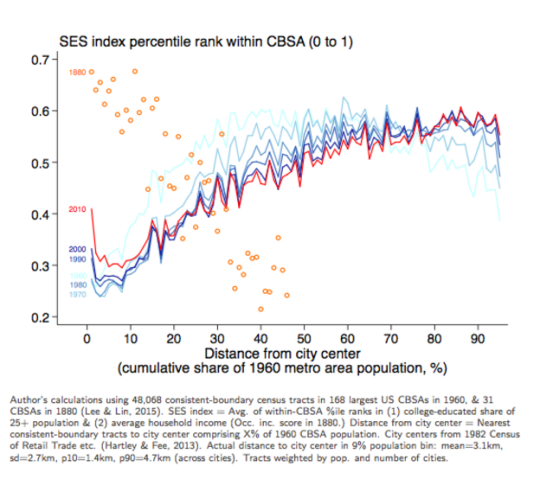
    Jeffrey Lin, who is an economist at the Federal Reserve Bank of Philadelphia, recently published the following chart:

    image

    I found it in this Washington Post article. And it’s packed full of fascinating information.

    The chart compares the socioeconomic status in US cities (y-axis) against “distance from city center” (x-axis) in 1880 and then in recent years (1960 to 2010 census data). The orange circles represent the 1880 data and the red and blue lines represent the recent census data.

    What this chart and research tells us is that in 1880, rich people overwhelmingly lived in the center of cities. And as you moved further away from the city center, socioeconomic status fell off pretty precipitously. This makes sense given that, at the time, it was hard to get around and travel long distances.

    However, in the post-war years, the exact opposite became true. We began driving and wealth decentralized. This should surprise no one. 

    But what’s interesting is how this appears to be reversing. In 2010 (the red line), there’s a sharp increase in socioeconomic status for people living basically right in the center of cities. And for the 30 – 60 km range, there has been a decrease in socioeconomic status essentially from the 1960s onwards. 

    The important takeaway here – which is spelled out in the Washington Post article – is that the neighborhoods which appear to be in high demand today are also in very short supply:

    “We have 80 years of essentially zero production of neighborhoods with these qualities,” Grant says. “We’ve spent the last 80 years building car-oriented suburbs. Then when the elites decide they want to go back into the city, there’s not enough city to go around.”

    This is one reason why supply matters.

  • The advantages of disadvantages in business and entrepreneurship

    This morning I stumbled upon an interesting book by Claudia Kalb called Andy Warhol Was a Hoarder: Inside the Minds of History’s Great Personalities

    I obviously haven’t read it yet, but I like the premise. The book examines 12 famous figures and makes the argument that each of them had some sort of mental health condition that aided them in their success. 

    Here is an excerpt from a recent Harvard Business Review interview with the author:

    “The most common one may be narcissism. Frank Lloyd Wright is a good example. He had classic narcissistic qualities — a sense of grandiosity, superiority, a huge and complete belief in his aesthetic sensibility, and disregard for architecture that did not live up to his standard. Narcissists also have an ability to be charming, and to lure people into their orbit. That’s obviously useful for an entrepreneur. The issue is that while these qualities may make you a good leader, they may not make you a winning boss. Employees often feel that narcissistic bosses are ruthless or lacking in empathy. Also, unlike people with depression or anxiety disorders, narcissists don’t suffer as much personally from their condition — but the way they behave can be much harder on the people around them.”

    Related to this topic is an emergent body of research that, more specifically, looks at the relationship between mental illness and entrepreneurship. And according to work done by professor Michael A. Freeman of UC-San Francisco and professor Sheri Johnson of Berkeley, there’s a significant relationship. 

    Below are two excerpts from a Washington Post article published last year.

    “Forty-nine percent of entrepreneurs surveyed reported at least one mental health condition. Nearly a third reported having two or more mental health issues, such as ADHD, bipolar disorder, depression, anxiety or substance use conditions. And half of the entrepreneurs who reported no mental-health conditions identified themselves as coming from families with a history of mental illness.”

    Why would these conditions be of any benefit to entrepreneurs?

    “For all of its ills, depression also brings empathy and creativity. Martin Luther King Jr. and Mahatma Gandhi attempted suicide as teenagers. Uncommon levels of empathy can allow a businessman to better understand a customer’s need. And a creative mind won’t be satisfied on the corporate ladder, but instead in a fast-moving start-up where he or she can unfurl ideas and dreams.

    Individuals with ADHD naturally make decisions faster, are comfortable working independently and are more creative, necessary skills at a start-up. They’re likely to be bored working for someone else.”

    From a city building standpoint, all of this is quite relevant. Because for all of the focus on promoting innovation and entrepreneurship, we don’t seem to be talking about healthcare and mental health systems. And there’s clearly an argument to be made that the two are connected.

  • Urban population densities, compared

    Earlier this month The Washington Post published an article called, There’s no such thing as a city that has run out of room.

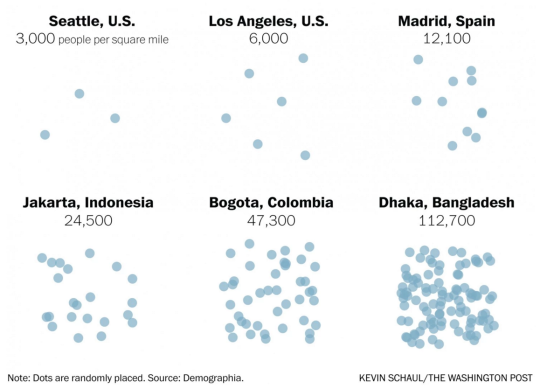
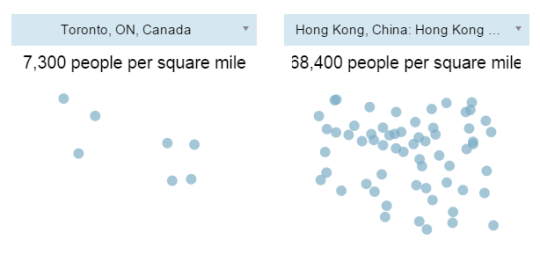
    And what it was really about was that when we say there’s no more room (I guess people are saying this), we are really saying that we just don’t want to allow anyone else to become our neighbor. Because the reality is that urban population densities vary widely around the world. So how can you really call a place full?

    I’m not sure I feel this pain point as much as the author, but I always find population densities to be a fascinating topic. And accompanying the article was a tool – using data from Demographia – that allowed you to compare the population densities of various cities.

    Here are are two scenarios I ran:

    It’s important to keep in mind that these numbers are averages for the entire economically contiguous region. So it tells you nothing about the potential spikiness of certain areas. That’s why the population density of New York (which includes portions of New Jersey and Connecticut) probably seems low to you.

    Still, it’s fascinating to see how extreme some cities – including some first world cities like Hong Kong – can be. Clearly many cities have a lot of room to become a lot more dense. And I think that would be a good thing.