Daily insights for city builders, delivered every morning at 6 AM ET. I’m Brandon Donnelly — a Toronto-based real estate developer and founder of Globizen. I’ve been writing here since 2013.
New rental housing measures were approved by Vancouver City Council this week. I haven’t gone through the policies in the detail (you can do that here), but they aim to increase rental housing supply by doing things such as “pre-zoning” for 6-storeys on main streets and by allowing rental apartments to be built on some side streets (up to 150m away from arterial roads).
Enabling new rental housing in all neighbourhoods would support an increase in supply and choice. The incentive programs have concentrated secured market rental development in selected neighbourhoods and along arterial streets. This has been effective at creating larger multi-unit projects, but has created an inequitable environment, where renters have limited housing choice. Expanding program coverage into low density areas, areas zoned for single detached housing and non-arterial locations to allow for a greater mix of structure types and densities (e.g. townhouses, small apartment buildings) are important considerations moving forward.
It is yet another data point for what I wrote about here — the loosening of single-family zoning. Turns out, it can be difficult to meet the demand for new housing when you set aside a large part — or most — of your land for low-rise single-family homes. And there seems to be growing acknowledgement of that on the part of cities.
There is something happening in many North American cities right now. We are starting to question the supremacy of zoning for only single-family homes.
This past summer, the state of Oregon passed policy requiring cities of 25,000 people or more to allow duplexes, triplexes, and fourplexes within their single-family home neighborhoods. Minneapolis is poised to do something similar with its Minneapolis 2040 plan (though it has been contentious). And, of course, here in Toronto we recently rolled out laneway suites all across the city. Small scale multi-family dwellings are also already permissible in some areas (though few are being built).
Some are calling this a YIMBY movement. But however you want to define it, it’s an acknowledgement that, if the goal is to built up instead of out, perhaps it’s time we look at the parts of our cities with the lowest population densities. I would also add that following my recent post on Paris vs. Vancouver, many seemed to gravitate (in the comments) toward the Parisian model — even if it did result in over 50,000 people per square kilometer. Density, it would appear, is okay.
While positive, it remains to be seen whether these policy changes will result in a meaningful increase in housing supply. And a lot of that will come down to the details. As I have said before on the blog, the math can be challenging on these sorts of smaller projects, which is why you have smart people proposing things like an “inverse density” rule to help encourage more smaller scale development.
But as the saying goes, sometimes you need to crawl before you can walk. And, if nothing else, there’s certainly symbolic value to what seems to be taking hold across North America right now.
In this January 2018 report from the Fraser Institute, they pegged the average population density of Paris to be about 21,067 inhabitants per square kilometer (2014 population year). It is the second densest city in their report after Hong Kong, but the densest in Europe. By comparison, Vancouver sits at around 5,493 inhabitants per square kilometer (2016 population year).
Now, these are of course city averages. Some neighborhoods will be higher and some will be lower. According to a January 2018 study by Alasdair Rae — who is a works in the Department of Urban Studies and Planning at the University of Sheffield — these are the most densely populated square kilometers across Europe (or at least within the 39 countries that he looked at).
Paris, once again, comes in near the top with a peak density somewhere around 52,218 inhabitants per 1km square. The square in question is in the neighborhood of Goutte D’Or. And the only square within the study to come in denser is one from the L’Hospitalet de Llobegrat in Greater Barcelona (53,119 inhabitants per square kilometer).
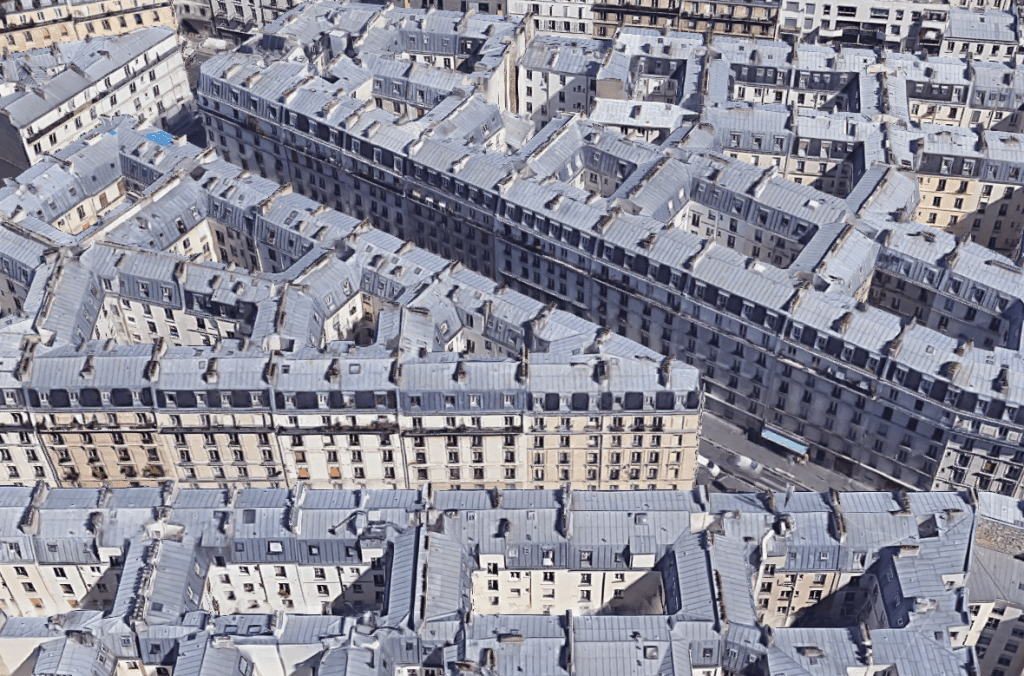
Now let’s take a look at how these sorts of densities actually manifest themselves. Below is an aerial capture from Google Maps showing a section of Goutte D’Or in Paris. The buildings are all pretty much 7 storeys (mid-rise), but the blocks are mostly filled in. Lots of interior courtyard apartments. This is one way to get to over 50,000 people per square kilometer.
Returning to Vancouver as a point of comparison, below is an aerial capture from downtown Vancouver at exactly the same scale as the Paris capture. I couldn’t find a density map of downtown, but it’s probably safe to assume that it’s greater than 5,493 and a lot less than 52,218 residents per square kilometer.
What you see here is typical Vancouverism. Lots of slender point towers, careful tower positioning and spacing, and generally low podiums. It is a perfect demonstration that height and density do not necessarily correlate. It is possible to have low buildings and high density, which is something that Europe obviously does very well.
But here’s the important question: In which of these two examples would you rather live? Please leave a comment below.
This week, RBC Economics published a study on Canada’s rental market where they argued that the pace of new supply needs to at least double in markets like Toronto in order to meet future housing demand and balance the market. Similar things, I’m sure, could be said about many other housing markets around the world.
The report pegs the current rental housing deficit in Toronto at about 9,100 units:
And because they believe that the cost of ownership is pushing more people into rentals, the number of renter households is expected to grow at an average rate of 22,200 units per year in Toronto.
If you take 22,200 units per year over the next two years, and add in the current deficit of 9,100 rental units, you get to a total count of 53,500 rental units. This is what RBC Economics believes must be delivered to the market in order to restore equilibrium, and decrease the upward pressure on rents.
Rental units are, of course, delivered to the market in two main ways. There’s purpose-built rentals and there are for-sale units that end up as rental housing. But even if you amalgamate both of these tenures, we are not building enough housing.
Against this backdrop, I find it curious that developers are so often vilified. Earlier this week, I saw Jennifer Keesmaat tweet out that — as we ready for this fall’s federal election — any sensible housing plan must move away from our current for profit housing delivery model.
Who, then, will build these 53,500 rental units? That part wasn’t clear to me.
A colleague of mine sent me this Bloomberg article today and said, “Here’s an article about things you already know.” The article cites a recent report by Altus Group that compared government-related fees on new housing across Canada and the U.S. What they discovered will not surprise any of you who are in the industry: Toronto has some of the highest government-imposed charges on new homes.
For new condo apartments, the report found that government charges can add up to as much as C$124,582 per unit. That’s about 50% higher than the average unit in the U.S. and about 30% higher than the average unit in Canada (see above chart for the list of cities). While all of us in the industry can appreciate this, I don’t think most homeowners and tenants understand this. Hopefully they’re reading this post.
In March 2018, Statistics Canada launched the largest “wastewater-based epidemiology pilot test” ever conducted in North America. Over a 12 month period, it collected wastewater samples across the country in order to test for traces of cannabis and other drugs. The pilot captured 8.4 million people in Vancouver, Edmonton, Toronto, Montréal, and Halifax. And it was allegedly timed to coincide with the legalization of cannabis in Canada on October 17, 2018.
This week Statistics Canada published its findings. While the study does cover over 8 million people, it was not intended to be representative of the entire Canadian population. Some sites, such as Vancouver, had nearly complete coverage of the metro area population. While others, such as the Halifax site, only covered about half of the metropolitan area. In any event, the findings are interesting.
Above is one example: methamphetamine load per capita for the five study cities. The y-axis is grams per million people per week. And the time period is, again, March 2018 to February 2019. Average levels for Edmonton and Vancouver were found to be about 3.7x higher than those in Montréal and Toronto. There was also no apparent seasonal/monthly variation, which is something else they looked at.
Here I learned that a large portion of this drug passes through the body unchanged. And so the concentrations they discovered in wastewater is likely a fairly direct indicator of consumption within the population. Stats Canada is still reviewing its findings and evaluating this approach to collecting large scale urban data. But I am certain we’ll be seeing more of these kinds of urban studies.
Jens von Bergmann (data analyst and mathematician); Nathanael Lauster (sociologist); and Douglas Harris (law professor) have been working since 2018 on a study of how condominiums are used and occupied across Canada. The goal is to use the results to better inform public and academic debate.
They recently presented some of their early findings at the National Housing Conference in Ottawa and have since made that information public. It is still a work in progress, but already there are some interesting takeaways. To start, here is a chart showing occupied housing units in Canada and in select CMAs:
Not surprisingly, Canada is broadly speaking a nation of single-detached houses. But in our three largest cities — Toronto, Montreal, and Vancouver — apartments/condominiums are doing a lot of the heavy lifting.
Vancouver has the highest proportion of condominiums. It is a geographically constrained metro area and it is one of the first cities in the country to adopt condominiums as a housing tenure. And in Montreal, there are more apartments under 5 storeys than there are single-detached houses. Not surprising. There’s no “missing middle” in this city.
But the really interesting question is, how are these condominiums being used and occupied? It’s a challenging question to answer, which is why it’s so often debated, but here’s what the researchers have found so far:
The owner and renter categories are self-explanatory. Temporary, which is the least common type of tenure, is where the owner has declared their principal residence as being somewhere else. In other words, the condominium is a second home.
The vacant category is effectively that city’s condominium rental vacancy rate. These are condominium units which are empty, but that are at the same time listed for rent. There are relatively few of these. In Toronto and Vancouver they’re virtually non-existent in this dataset (2016).
Finally, we get to unoccupied units. This one is tricky and the researchers aren’t exactly clear on what is driving this number. They chalk it up, at least partially, to the flexible nature of condominiums. For example, it could be empty because the unit is switching from owner-occupied to rental, or vice versa.
That said, it is very interesting to note that Toronto and Vancouver actually have the lowest percentage of unoccupied condominium units. This may be surprising to some of you given the public discourse around investor units in these two cities.
Generally, they found that in Canada’s three largest metro areas, the following rule of thumb seems to apply: For every 10 condominium units built, 6 will become owner-occupied, 3 will enter the rental stock, and 1 will go unoccupied. Does that seem right to you?
If you’d like to dig into the methodology that the researchers used, you can do that over here at Mountain Doodles. All of the charts and data used in this post were taken from there.
Bloomberg recently reported that Canada admitted 321,065 permanent residents last year. This is up 12% from 2017, where the country admitted 286,479. Last year was also the largest cohort since 1913 (the year before World War I), where the country admitted just over 400,000 people.
Here is a chart from Bloomberg (it is interactive if you click through):
Of course, Canada was a much smaller country back in 1913 (about 7.6 million people), and so on a percentage basis we are much lower than where we were at the beginning of the 20th century. We’d have to admit close to 2 million permanent residents a year to get to a similar rate.
I couldn’t find a geographic breakdown for last year, but in 2017, about 40% of admitted permanent residents (or 111,925 total) ended up in Ontario and about 72% ended up in Ontario, Quebec, and Alberta (the top 3 provinces for this year). If we add in BC, it brings this figure up to 86%.
Here are also the top 10 countries of origin:
If you’d like to download a PDF of the full report, you can do that here.
This week two new office buildings were announced in Toronto and Vancouver by Allied Properties and Westbank. Both are being designed by Bjarke Ingels Group (BIG). As you would expect, Alex Bozikovic of the Globe and Mail has done a proper writeup, here.
The building in Toronto (called Union Centre) is generally located at 171 Front Street West. It is a revision to a previous proposal for the site that was originally submitted back in 2014. That project got approved by Council, but the implementing by-laws were never enacted.
It clearly shows the big idea behind the project, which is to push all of the building’s elevator shafts to its north elevation. This opens up its large floor plates to the south, but also allows for a kind of elevator equalizer show on the outside of the building. The cabs are intended to be lit and the shafts are intended to be built using clear glazing. That’s what you’re seeing above.
I don’t think we have enough fun with building lights here in Toronto. So I was pretty pumped to see this get proposed. What are your thoughts?
This week’s federal budget announced two measures that are intended to improve housing affordability.
The first is a modification to the Home Buyers’ Plan. This is a plan that gives first-time home buyers the ability to do a tax-free withdrawal from their RRSP (it does, however, have to be repaid within 15 years). The withdrawal limit was increased from $25,000 to $35,000.
The second measure, which is the one that got everyone’s attention, is the new First-Time Home Buyer Incentive. Through this program, CMHC will offer first-time home buyers (who have the minimum down payment required for an insured mortgage) the option of a “CMHC shared equity mortgage.”
What this effectively means is that CMHC will give first-time buyers an interest-free contribution for 10% of the purchase price of a new home (5% in the case of a resale). There’s no interest, but it does need to be paid back at the time of a sale. The higher percentage for new build homes is intended to stimulate housing supply.
It is still not clear whether CMHC will be expecting to participate in any increase (or decrease) in the value of the properties. But presumably, yes, since it’s called a “shared equity mortgage.” All of this is expected to come into force by the fall.
Here’s an example of how this program is intended to work.
If a first-time buyer purchases a new home for $400,000 with a 5% down payment, the insured mortgage amount would normally be $380,000. This is the highest loan-to-value you can get with CMHC mortgage loan insurance. With this new measure, the mortgage size would reduce to $340,000 and so the purchaser’s monthly debt service would drop accordingly, thereby helping with overall affordability.
The caveat to all of this is that this incentive will only be available to first-time home buyers with a household income under $120,000, and the insured mortgage and incentive amount cannot be greater than 4x the participants’ annual household income.
What this means is that this program really only touches the sub $500,000 market. And in highly desirable cities like Toronto and Vancouver, that market isn’t all that big.