Daily insights for city builders, delivered every morning at 6 AM ET. I’m Brandon Donnelly — a Toronto-based real estate developer and founder of Globizen. I’ve been writing here since 2013.

Tag: us cities

  • A look at “tree equity” across the United States

    American Forests, which is a US non-profit conservation organization, publishes something that they call a Tree Equity Score. What it effectively does is map tree cover across US cities. You can explore what that looks like, here. The score considers things like tree canopy, population density, income, race, as well as many other factors, and then produces a single score from 0 to 100. A score of 100 means that a neighborhood has achieved “Tree Equity.”

    There is seemingly a lot that you can glean from this score. For one, American Forests have found that income and race tend to correlate with tree canopy. Lower income neighborhoods tend to have less of it and rich neighborhoods tend to have more of it. You can start to see what that looks like in the Instagram post embedded at the top of this post. If it isn’t showing up, click here.

    But the other thing that is clear from these images is that rich people tend to consume more space. The richer tree-canopied neighborhoods appear to be less dense. The lots are bigger. And there are instances where the homes look to be adjacent to some large contiguous green spaces. This, of course, is a natural market outcome.

    The Tree Equity Score tries to correct for this in its methodology. If a neighborhood’s population density is very low (less than 2,000 people per km2), then it gets a higher tree canopy adjustment factor. It should have more trees. Conversely, if a neighborhood’s population density is high (over 8,000 people per km2), then it’s acceptable for there to be less trees (lower adjustment factor).

    That said, it would be interesting to see a direct comparison of two neighborhoods — one rich and one poor — that have the exact same population densities and overall built form. I think that would speak volumes about tree inequity. I am also very curious about the global relationship between density and household incomes.

    If any of you have a good source, please share it in the comment section below.

  • Urbanization since the 14th century

    This morning I stumbled up on this conversation between Richard Florida and Ed Glaeser about the post-pandemic city. It’s from September 2020 and that is obvious in some of the comments. Richard Florida (who was in Toronto) remarked that it felt like the pandemic was mostly over at that time and that Canada had seemingly done a much better job than the US at tackling it. That no longer feels right. But I did find myself agreeing with some of their other points.

    Here’s one from Ed Glaeser that looks back to previous health crises:

    But pretty much since the 14th century, urbanization proceeded despite the reappearance of the Black Death in the 1350s. Urbanization proceeded despite the Great Plague of London in the 1660s. All of the great diseases that spread in 19th-century America, cholera, yellow fever, the urbanization just chugged along. Even the influenza pandemic of 1919-1920 was followed by a tremendous decade of city building. So, I think our cities have proven to be remarkably resilient.

    For the full conversation, click here.

  • Do Canadians embrace winter?

    Curbed published an article this week called, Why U.S. cities should stop whining and embrace winter. It is about Canada and how we allegedly embrace winter, which is arguably true, except I think there’s still a healthy dose of whining combined with trips to the south.

    I went ice skating a few weeks ago along the waterfront here in Toronto. It was a cold night and we debated whether we should skate or do something indoors involving Niagara’s finest red wines. We opted for skating and weren’t cold at all. It was great.

    I was reminded of this when I read the line: “The purpose is to get you skating. If you are skating, you are warm.” It is a good reminder that one of the keys to a successful winter space is physical activity. That and hot tubs.

    Photo by Joseph Barrientos on Unsplash

  • New York is the only US city with an urban core growing faster than the suburbs

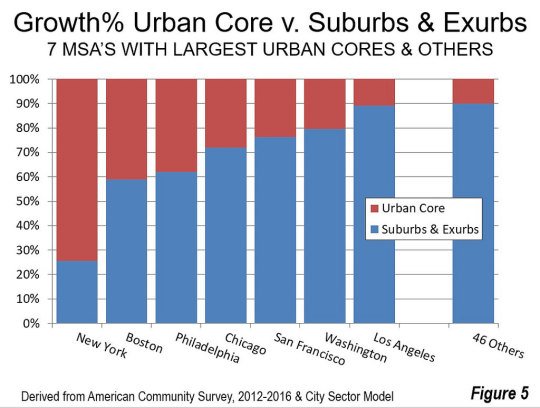
    The latest data from the American Community Survey (2012 to 2016) has placed the suburban and exurban share of the US population (53 major metropolitan areas) at 85.5%. Back in 2000 this number was thought to be around 83.5%.

    Since 2010, automobile oriented suburbs and exurbs have also accounted for 90.5% of population growth. The US – and Canada would be no different – is by and large a suburban nation. And the data suggests this isn’t about to change.

    The one exception is the New York metro area. From 2012 to 2016, 74% of its growth happened in the urban core. No other major metropolitan area in the US comes close to this sort of urbanity. Below is a chart from New Geography that shows you how NYC compares.

    All of the data for this post was also taken from New Geography.

  • Where the jobs are being created in cities

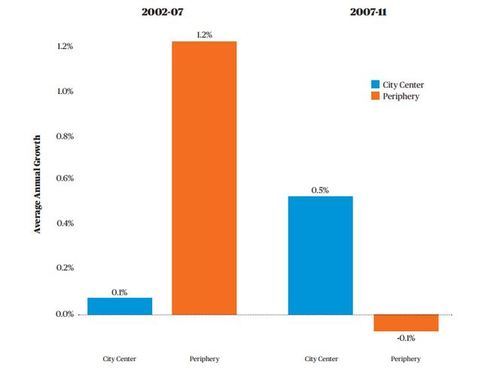
    According to a new report released by City Observatory, US cities have officially reversed a 50-year trend towards decentralization.

    We know that urban living has been seeing a renaissance over the last decade or so, but as recently as 2002 – 2007 (pre-Great Recession), the suburbs and peripheral areas were still seeing significantly higher job growth: 1.2% per year in the periphery versus 0.1% in the city center. The “city center” is defined as a 3 mile radius around the center of the city in this study.

    However since 2007 things have flipped:

    image

    Chart Source: City Observatory

    Why is this happening? Here’s a snippet from City Observatory:

    The strength of city centers appears to be driven by a combination of the growing attractiveness of urban living, and the relatively stronger performance of urban-centered industries (business and professional services, software) relative to decentralized industries (construction, manufacturing) in this economic cycle. While it remains to be seen whether these same patterns continue to hold as the recovery progresses, (the latest LEHD data on city center job growth are for calendar year 2011), there are structural forces that suggest the trend of center-led growth will continue.

    In some ways, it just makes intuitive sense. People started returning to cities and so the jobs followed (although there were also structural changes to the economy). 

    The big question, however, is whether this trend will continue? My bet is on yes. What do you think?