Daily insights for city builders, delivered every morning at 6 AM ET. I’m Brandon Donnelly — a Toronto-based real estate developer and founder of Globizen. I’ve been writing here since 2013.

Tag: us census bureau

  • Sticking close to home — two-thirds of young Americans live near where they grew up

    Here in Canada, there is often a belief that Americans tend to be more mobile than Canadians. Don’t like the cold weather? Just move south. Taxes too high? Just move south. Housing too expensive? Just move south.

    But just how mobile is mobile? A new study by the US Census Bureau and Harvard University found that by age 26, more than 2/3 of young adults in the US actually just live where they grew up, with 80% living within 100 miles, and 90% living within 500 miles.

    Migration distances were also found to be impacted by both race and parental income (though these two things likely exhibit a relationship on their own). If you are a young white or Asian adult, the “radius of economic opportunity” tends to grow and you’re more likely to live further away from where you grew up.

    The most popular destinations overall are New York, Los Angeles, Washington, and Denver (in this order). And while New York and Los Angeles remain at the top regardless of who you are, San Antonio and Phoenix are top destinations for Hispanics, and San Francisco is a top destination for Asians.

    Regardless, home appears to be a pretty sticky place.

    But what about Canadians? Are we less mobile? Looking at net domestic migration rates, Canada saw 254,143 interprovincial migrants between 2018-2019, whereas the US saw just over a million between 2020-2021. So on a per capita basis, Canada’s rate is actually higher.

    Statistics Canada also estimated earlier this year that as of July 1, 2016, somewhere around 4 million Canadians were living abroad — or about 11% of citizens. This is a much higher percentage compared to Americans.

    Of those living abroad, roughly half are believed to have received their citizenship through descent, meaning they were born abroad to Canadian parents. About 1/3 are Canadian citizens by birth. And about 15% are naturalized citizens.

    So it turns out that Canadians are in fact pretty mobile. We also seem to like going further afield.

  • Missed housing payments in the US

    Back in April, the US Census Bureau started running weekly surveys in order to try and assess how COVID-19 was impacting people’s lives. They call this the “Household Pulse Survey.” They’re now up to week 12, with the latest data running up until July 21, 2020. Here’s some housing data that I think many of you will find interesting:

    • The July 1, 2019 population estimate for the US was 328,239,523, of which about 77.7% are persons 18 years or older.
    • One of the things that the survey looked at was the total population 18 years or older living in owner-occupied and renter-occupied housing. About 148 million people (~60%) identified as living in the former, about 78 million (~29%) identified as living in the latter, and about 27 million people (~11%) did not report their tenure. This seems to jibe with point number one and the overall home ownership rate in the US.
    • For the owners, 1/3 reported to own their home “free and clear” of a mortgage and about 58% said that they made last month’s mortgage payment. So about 91% of owners were seemingly okay in June. The remaining ~9% were people who either got a mortgage payment deferral, or simply didn’t pay. About 0.5% did not report.
    • For the renters, about 5% reported to be living in a home with free rent and about 75% said that they made last month’s rental payment. Over 18% said that they missed last month’s rent and just over 2% said that they had their rent deferred. The remaining 1% or so are people who simply did not report.
    • Combining both tenures, it looks like about 12.5% to 13% of respondents had a bit of a problem paying their housing costs last month. (I’m giving a range, because presumably the “did not report” crowd could go either way.) I don’t know about you, but this number doesn’t seem all that shocking to me.

    If you would like to download a copy of all of the survey results, click here.

  • More than 1 in 4 Americans now live alone

    The percentage of single-person households in the US has been steadily increasing since the 1960’s (though the rate of increase has moderated in recent decades). As of last year (2018), 28% of Americans lived alone, according to the US Census Bureau. So about 1 in 4 households. This is in comparison to 13.1% of households in 1960.

    Here is a chart from a recent WSJ article on the topic:

    Not surprisingly, this is changing how marketers target households. Affluent, single-person households in urban areas have proven to be a boon to product makers because they tend to spend more per person and they tend to value time > money. Of course, this phenomenon also has implications for those of us who work as city builders.

    For more historical household tables from the US Census Bureau, click here.

  • From urban to suburban

    The US Census Bureau just released its population estimates for 2018. As has been the case in previous years, the counties that added the most people (largest numeric growth) are all located in the south and west. Texas holds 4 out of the top 10 spots.

    Here is a Tweetstorm by Jed Kolko, the chief economist of Indeed, with a couple of graphs summarizing the findings (click through to see the full thread):

    Despite the narrative that people are returning to cities and urban centers, the data is pretty clear: the flow of domestic migration within the US is largely from dense urban counties to more suburban — and affordable — ones. Big cities are expensive.

  • Fastest growing large cities in the US

    Last week the US Census Bureau released its 2017 population estimates for the largest cities in the country. All of the figures are for the city itself and not the broader MSA or some other boundary.

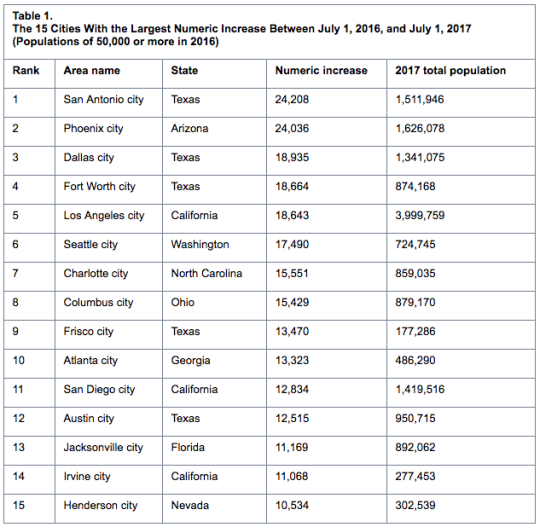
    Here are the top 15 cities with the largest numeric increases between July 1, 2016 and July 1, 2017:

    However, if we switch over to percentage increases, Frisco, Texas – which is part of the Dallas-Fort Worth metro area – jumps up to number one with an increase of 8.2%. 

    In fact, the top 3 cities (on percentage basis) are in Texas and 10 of the top 15 cities are located in the South. That shouldn’t come as a surprise to many of you. Related post: Follow the sun and sprawl.

    However, if we only consider the 25 largest cities in the US, the fastest growing city on a percentage basis was Seattle at 2.47%. Number two was Fort Worth at 2.18%. And number three was Charlotte at 1.84%.

    New York City sits at 0.08%. And Detroit lost people. But it’s not a horrible figure (-0.35%). For more tables and data, click here.

  • Rural America is the new inner city

    There’s an argument going around these days that rural America is the new inner city. That is, rural America has replaced inner cities as the geographies facing the greatest socioeconomic challenges. 

    In fact, it’s time for the stigma associated with the term “inner city” to disappear – if it hasn’t already. Blight no longer seems to be the concern. Instead, the concern is that our inner cities are becoming exclusive enclaves for the rich.

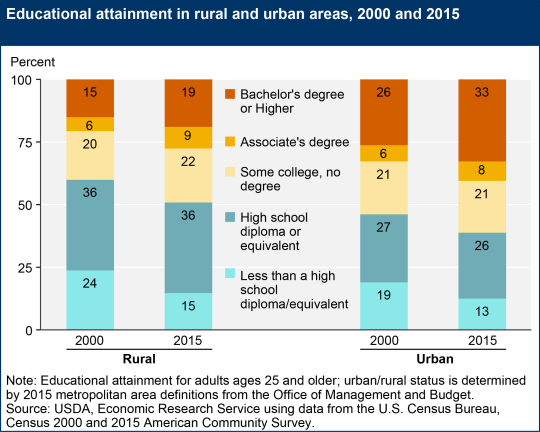
    The United States Department of Agriculture recently published data on educational attainment within rural areas. And since education is one of the biggest drivers of economic prosperity, it’s valuable to look at this data. 

    The first thing to note is that while educational attainment within rural areas is increasing, it still lags urban areas:

    image

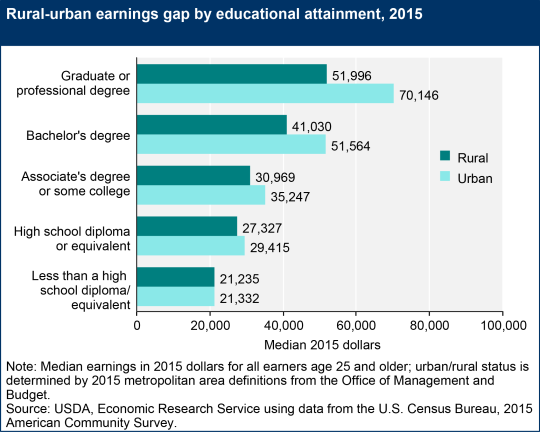
    The second thing to note is that even with the same level of higher education, the labor market will generally pay you more if you live in an urban area:

    image

    However, the spread between rural-urban increases as you move up the education ladder. With less than a school diploma, there isn’t much difference. But with a graduate or professional degree, there’s about a ~35% increase in earnings, on average, according to the above chart.

    So it should come as no surprise that many smart and educated people are choosing to live in urban areas. They should make more money.

    All charts from the U.S. Department of Agriculture.

  • Follow the sun and sprawl

    image

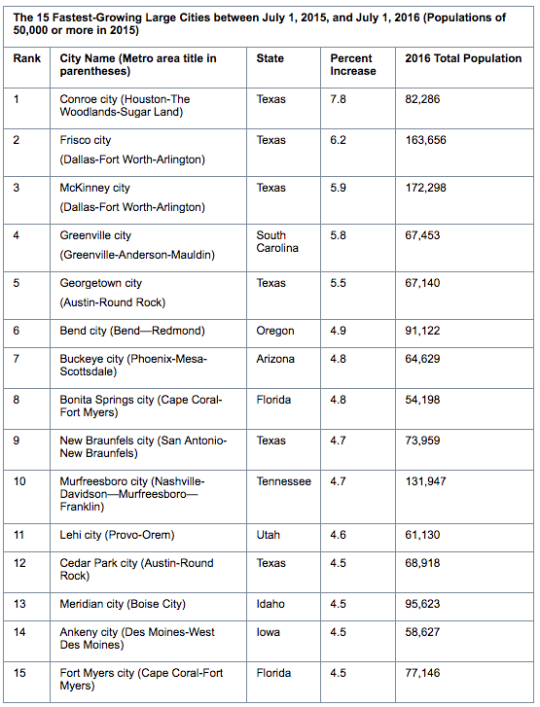
    The U.S. Census Bureau recently released it’s 2016 city and town population estimates. The press release can be found here.

    The headline isn’t a new one. Southern cities continue to grow quickly. This is not a new trend. Humans seem to like warm weather and the housing supply in southern cities tends to be more elastic. This keeps home prices relatively in check and allows the cities to more easily accommodate growth.

    From July 2015 to July 2016, 10 of the 15 fastest growing large U.S. cities were in the south (based on % growth). 4 of the top 5 were in Texas. 

    From 2010 to 2016, the population in large southern cities grew an average of 9.4%. Cities in the west clocked in at 7.3%. And cities in the northeast and midwest were at 1.8% and 3.0%, respectively.

    Two outliers near the top are Seattle and Denver. Since 2010, the population of these two cities grew 15.39% and 14.87%, respectively. I’m going to say it’s because of the skiing and snowboarding. Half-joking. For the top 25 large cities ranked by 2010-2016 growth rate, click here.

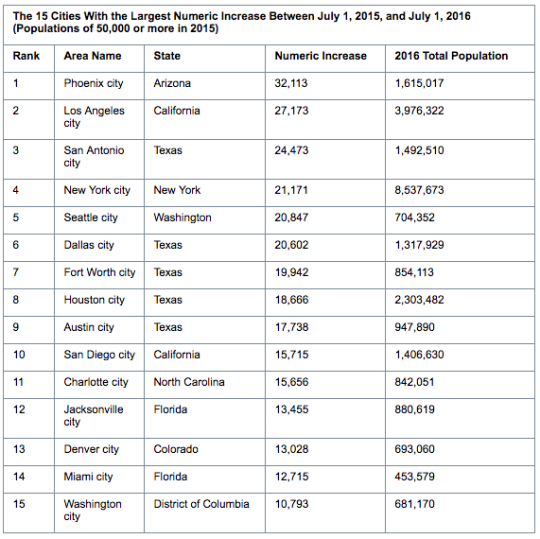
    In terms of absolute humans, Phoenix had the largest numeric increase between 2015 and 2016: 32,113 or about 88 people per day. After Phoenix it’s Los Angeles (27,173), San Antonio (24,473), New York (21,171), and Seattle (20,847). These are all city proper figures.

    It’s also worth noting which large cities aren’t growing. From 2015 to 2016, Chicago fell -0.32% and Detroit fell -0.52%. Philadelphia was only slightly positive at 0.19%. Going back to 2010, Chicago is still flat at 0.27% and Detroit is even more negative at -5.39%. Philadelphia is 2.5%.

    Follow the sun and the sprawl.

    The below charts are from the United States Census Bureau.

    imageimage

  • The suburbanization of America continues

    FiveThirtyEight (Jed Kolko) published a post last month called, “Americans’ Shift To The Suburbs Sped Up Last year.” 

    What Kolko did was take recent population estimates from the US Census Bureau and group them into 6 categories based on the size of the metro and its population density. 

    By doing this he discovered something that runs counter to the narrative that we are living through an urban renaissance: lower-density suburbs grew faster than urban counties. The former grew at ~1.3% in 2016. And in the south and west, the lower-density suburbs of large metro areas topped over 2% growth.

    What gives? 

    Well, this urban renaissance is lopsided. Here’s an excerpt from the article:

    That revival is real, but it has mostly been for rich, educated people in particular hyperurban neighborhoods rather than a broad-based return to city living. To be sure, college-educated millennials — at least those without school-age kids — took to the city, and better-paying jobs have shifted there, too. But other groups — older adults, families with kids in school, and people of all ages with lower incomes — either can’t afford or don’t want an urban address.

    Richard Florida is calling this phenomenon: The New Urban Crisis.

  • Multifamily vs. single family

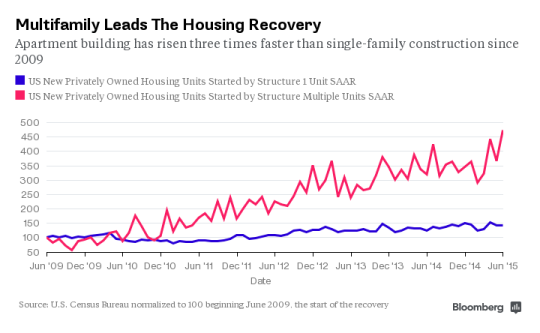
    Since 2009 when the U.S. economy started to recover, housing starts (i.e. new residential construction) have favored multifamily buildings over single family housing. Apartment/condominium construction has grown 3 times faster according to the U.S. Census Bureau (via Bloomberg).

    image

    A lot of this multifamily construction is assumed to be rental apartments, but this category also includes for sale condominiums. The classification has to do with building typology rather than housing tenure. (I would love to see how the above graph breaks down in terms of the latter.)

    The typical explanations for this trend often relate back to Millennials being poor and saddled with student debt. That’s why they’re delaying buying single family homes. But eventually the expectation is that they will resume doing

    (largely) what previous generations have done.

    Money and the economy, I’m sure, have something to do with the above trend. But I’m not convinced that it’s the whole story. 

    There are also shifts happening with respect to consumer preferences and with respect to how we plan and build our cities. That’s why I’m very interested in monitoring family formations and housing choices. 

    At the same time, I’m also a Millennial. And whenever I catch myself thinking a certain way, I assume that there are probably other Millennials out there who feel similarly.

  • Rise of rental

    image

    Last month Oxford Properties submitted a site plan application for the redevelopment of the rundown Cumberland Terrace in Toronto’s Yorkville neighborhood. If you’d like to browse the full application (including all the drawings), you can do that here.

    The proposal is a departure from previous plans and now includes 3 buildings: a 4.5 storey building, a 2.5 storey building, and a midblock 54 storey residential tower (the lobby is shown above). There will be both retail and residential uses.

    For those of you familiar with the mall, it should go without saying that Cumberland Terrace is in desperate need of redevelopment. So I’m not going to talk about that today. Instead, I’d like to mention 2 other points that stood out to me about the application.

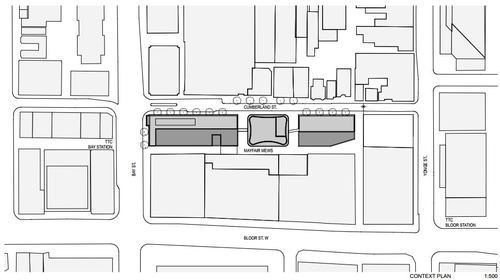
    The first is the 2 midblock connections on either side of the tower, running from Cumberland Street to Mayfair Mews in the rear (see below). Yorkville has a history of intimate laneways, and so it’s nice to see some of this being carried through in a new development. It also opens up the opportunity for an improved Mayfair Mews.

    image

    Secondly, it’s somewhat surprising to see that the 54 storey residential tower is being proposed as rental. Toronto doesn’t build a lot of purpose-built rental apartment buildings. There are some (from the likes of Morguard and Concert Properties), but we haven’t done it at scale for decades. And that’s largely because the demand for condos has been so great.

    But recently I’ve been noticing a renewed interest from the real estate community in multi-family rental assets. Cadillac Fairview also proposed a 65 storey rental building at the north west corner of Yonge Street & Queen Street last year – though they later withdrew their application.

    image

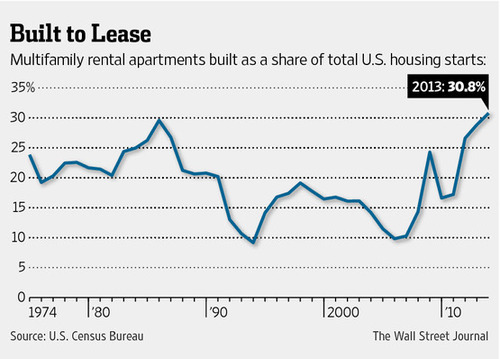
    In the US, rental apartments as a share of all new housing is also at record highs – over 30%. And that’s partly because credit remains tight (certainly compared to pre-2008) and economic growth has been tepid. But also because of demographic changes. People are having fewer children, later in life, and so many are putting off buying.

    So I think we’re going to see even more rental apartments being built in Toronto in the coming years.