Daily insights for city builders, delivered every morning at 6 AM ET. I’m Brandon Donnelly — a Toronto-based real estate developer and founder of Globizen. I’ve been writing here since 2013.

Tag: urbanism

  • Amazon’s economies of density

    According to Amazon’s recent annual 10-K filing, the company leased and owned (most of their space is leased) about 288,419,000 square feet of space around the world at the end of 2018. Of this number, about 80% is used for “fulfillment, data centers, and other.” Amazon doesn’t break out this line item any further, but GeekWire reckons that a good 3/4 of their real estate is dedicated to their fulfillment warehouses.

    Here’s the full summary of their facilities (from the 10-K filing):

    Given that fulfillment is such a large share of their properties, I am most interested in understanding the geography of their warehouses and how that impacts their core value proposition, which is largely all about convenience.

    In April 2017, Jean-François Houde (of Cornell), Peter Newberry (of Penn State), and Katja Seim (of UPenn) published a paper on this very topic called, Economies of Density in E-Commerce: A Study of Amazon’s Fulfillment Center Network.” There’s also this Knowledge@Wharton podcast on the paper if you’re looking for a quicker listen or read.

    In the early days of online retail, the decision of where to warehouse had meaningful tax implications. Because (in most cases in the US?) you only had to collect sales tax if you had a physical presence in the same location as your purchasers.

    As that changed, it then made more sense to create a broader distribution network and minimize the distance between fulfillment center and purchaser. By 2016, Bloomberg estimated that nearly 78 million Americans lived in a zip code where Amazon offered free same-dame delivery. That number has obviously increased since.

    And in the paper “Economies of Density”, they discovered the following cost savings as a result of Amazon’s growing fulfillment network:

    We find that Amazon saves between $0.17 and $0.47 for every 100-mile reduction in the distance of shipping goods worth $30. In the context of its distribution network expansion, this estimate implies that Amazon has reduced its total shipping cost by over 50% and increased its profit margin by between 5 and 14% since 2006. Separately, we demonstrate that prices on Amazon have fallen by approximately 40% over the same period, suggesting that a significant share of the cost savings have been passed on to consumers.

    The interesting question for real estate people and city builders — which is brought up in the Knowledge@Wharton podcast but is difficult to answer — is whether there are diminishing returns to this “economies of density” phenomenon. In other words, how dense does Amazon’s fulfillment network want to be?

  • Shaping Cities in an Urban Age

    Shaping Cities in an Urban Age is the third book to come out of the London School of Economic’s Urban Age project. It was published last fall. The first two titles were, Living in the Endless City (2011) and The Endless City (2007).

    If you’re familiar with the first two publications, you’ll know that these books are heavily illustrated. Lots of maps, charts, and diagrams. So they make great coffee table books. But they’re also filled with insightful essays — this one has 37 of them.

    In this particular book the focus is on the following:

    “It identifies current trends that are making cities more fragmented, less equitable and environmentally more damaging, and argues powerfully for a more integrated social, environmental and spatial approach that can inform and inspire city-makers that are shaping an increasingly urban world.”

    I am sharing this with all of you today because I have always really enjoyed these books. They have a way of quickly putting things into perspective globally.

    Around 2.5 billion more people are expected to live in an urban agglomeration by 2050. And 90% of this growth is expected to happen in just two places: Asia and Africa. This is an unprecedented shift that will obviously create many challenges and many opportunities.

    This book is about that.

    Image: Phaidon

  • Construction update — MIRA, San Francisco

    The MIRA Tower in San Francisco is one of my favorite buildings by Studio Gang and probably my favorite tall building under construction right now. Here’s a video and a few photos from the San Francisco Chronicle’s urban design critic, John King:

    When we first met Studio Gang, this project hadn’t yet started construction. They broke ground in April 2017. But it was one of the designs that got us particularly excited about what a Studio Gang building could mean for midtown Toronto.

    Now that the MIRA Tower is well underway, I have to say that it looks even better than it did pinned to the walls of their Chicago studio. I can’t wait to see it in person once it’s complete.

  • Height vs. density

    This Planetizen article (2014) by Brent Toderian surfaced over the weekend. It is about tall buildings and why we should be focused more on how they are designed, as opposed to just how tall they are. Brent talks about this in terms of “density done well.”

    One of the things that is often misunderstood when it comes to tall buildings is the relationship between height and density. It is often assumed that the two are perfectly correlated; but they’re not, which is why I like this quote from the above article:

    “Height and density have a relationship, one that can be over-simplified or mischaracterized, but they aren’t the same thing – you can have density without height, and yes, you can have height without density.” -Brent Toderian

    Part of the challenge is that density is a more nuanced metric. Height, on the other hand, is a lot easier to understand. How tall is this building? Oh, it is x storeys tall. But that’s only one piece of the puzzle.

    Photo by Erwan Hesry on Unsplash

  • Cost-plus pricing

    Today, Urbanation released its Q4-2018 market highlights report for the Greater Toronto Area. 

    The general media will pick up these numbers and tell you that there’s been a precipitous decline in the number of new condominium sales. But the reality is that 20,028 units were sold in 2018, which is actually in-line with 10-year averages for this region. 2017 was a particularly frenetic, and unsustainable, year.

    The average pre-construction sold price for a new condominium in the former City of Toronto (the core) was $1,117 psf last year, and $921 psf across the broader region. These numbers represent significant double digit increases from the year prior. But again, what I don’t think many people appreciate is that the cost environment has also changed dramatically over the last few years.

    Construction costs are way up, as are development charges and a myriad of other pro forma line items. The above numbers are simply a result of cost-plus pricing. Here’s where costs are at and here’s where we need to be to make the project feasible. Margins haven’t increased; in fact, they’ve probably been squeezed for many developers.

    I think this is an important topic that deserves more transparency and visibility. So I’m hoping to work with a developer friend of mine and publish something more substantial in the coming months.

  • New York City’s $35 billion nightlife economy

    image

    The Mayor’s Office of Media and Entertainment in New York City recently commissioned this report on the city’s nightlife economy. The study was completed by Econsult Solutions, the North Highland Company, and Urbane Development. (Full disclosure: I was a teaching assistant for the President of Econsult while at Penn.)

    Here’s what they found:

    The total economic impact of this industry is the sum of its direct, indirect, and induced economic impacts, as well as the ancillary spending impacts that are adjacent to nightlife activity. In 2016 (the most recent year where standardized datasets were available), the nightlife industry supported 299,000 jobs with $13.1 billion in employee compensation and $35.1 billion in economic output. This economic impact also yielded $697 million in tax revenue for New York City.

    They also found that, between 2011 and 2016, the nightlife industry has outpaced the city’s overall economy. Nightlife establishments grew by a 2% annual growth rate. Jobs in the nightlife industry grew by a 5% annual growth rate. And nightlife wages have been rising by 8% annually – about double the average for the city.

    I am a firm believer in the value of the nighttime economy. So I’m happy to see more people paying attention to it as of late. For the full report, click here.

    Photo by Markus Spiske on Unsplash

  • Non-load-bearing curtain wall

    image

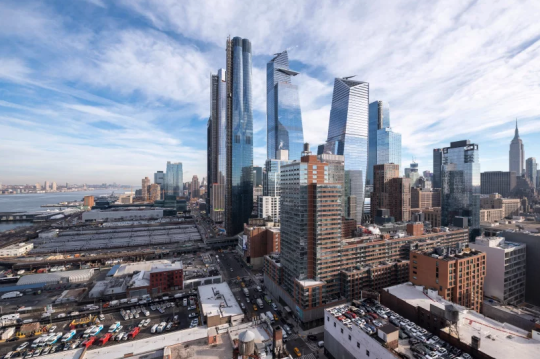
    Liz Diller of Diller Scofidio + Renfro was recently asked by designboom about how her firm approached the design of Fifteen Hudson Yards (the first residential tower in New York’s Hudson Yards).

    The firm had never designed a high-rise before. So while their typical approach would be to analyze program, here they were heavily informed by the views – both in and out from the site – as you move up the tower.

    The 88 storey tower transitions between two footprints. The base matches the street grid of the city, but as you move up the tower it transforms into a cloverleaf – allowing panoramic views of the city.

    It is a somewhat similar approach to what has been proposed by Studio Gang for One Delisle. Except for the transformation here is to a multifaceted cylindrical shape (a hexadecagon is what has been drawn).

    From the late 19th century when Chicago began to pioneer the modern skyscraper, architects and engineers have been thinking about how you treat a tall building as you move from top to bottom.

    Chicago architect Louis Sullivan responded to this challenge with his tripartite approach to design. He believed that tall buildings should be characterized by three main divisions: a base (bottom), a shaft (middle), and a cap (top).

    The technological innovation that allowed this thinking to flourish was the non-load-bearing curtain wall. Once the exterior walls of a tower no longer supported the actual building, architects then had the freedom to really experiment.

    This remains true to this day, but we no longer need to confine ourselves to only three parts. New technologies now allow for more.

    Today we have parametric modeling and other design tools that allow us to create new geometries and transitions; forms that would have been pretty complex to draw up in the past. 

    In the case of Fifteen Hudson Yards, every floor plate from 20 something and up is slightly different. I wonder what Louis would think of this.

    Image: Timothy Schenck via designboom

  • Laneway house on the market for $2,845,000

    I was looking at this laneway house for sale in Toronto today. It’s located near Queen and Bathurst. It has 3 bedrooms and 3 bathrooms and is about 2,331 square feet (that looks to include a basement). The lot appears to be just over 13′ wide. And the asking price is $2,845,000.

    Single family homes aren’t typically considered on a per square foot basis, but if you do the math here, it works out to be around $1,220 psf. The property previously sold in 2017 for $805,000, which was prior to it being redeveloped. So it likely traded based on land value.

    When Toronto first started considering modern laneway houses, some people thought that only individuals of questionable moral fiber would want to live in one. But today, there are countless examples of some pretty remarkable laneway houses. 

    And in some cases you might need about $3 million or so.

  • Tallest buildings completed in 2018

    image

    The Council on Tall Buildings and Urban Habitat (CTBUH) recently published their annual study looking at all of the 200+ meter tall buildings completed over the last year.

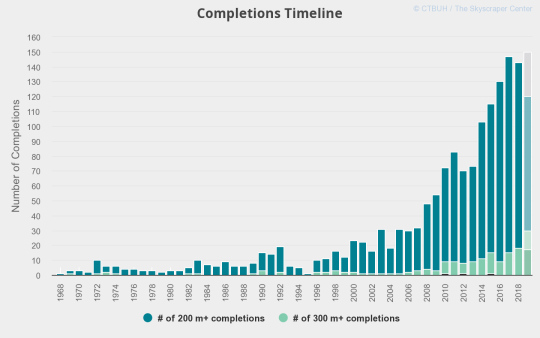
    143 were completed around the world. The all-time record was 147, which was in 2017. Last year, 18 “supertalls” were also completed. A supertall building is generally defined as having a height of 300m or more.

    The tallest building completed in 2018 was China Zun in Beijing. Pictured above. It is 527.7m tall (to tip), but the occupied height is 513.5m. 

    It was designed by Kohn Pedersen Fox Associates and looks like a Chinese finger trap. All iconic buildings deserve an endearing nickname, right?

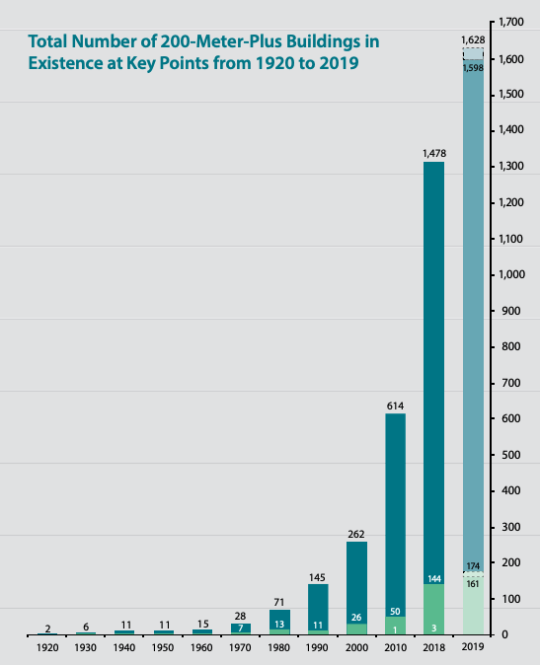
    Below are a few interesting charts from the report. The first is the total number of tall buildings over 200m from 1920 to 2019. At whatever point they chose in the 1920s, there were only 2. Things sure changed starting in the 1980s.

    image

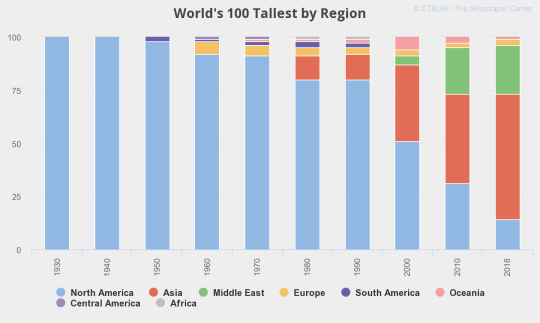
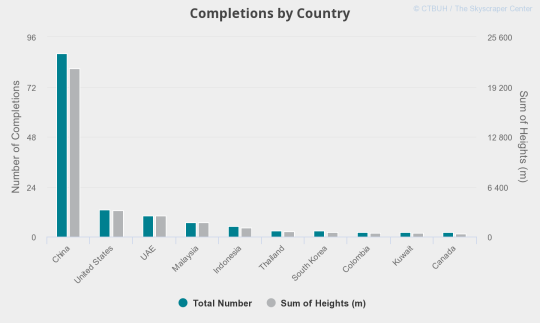
    That exponential growth happens to coincide with tall building growth in Asia and in particular China. The next few charts show (1) the handover from North America to Asia; (2) completions per year (broken down by talls and supertalls); and (3) completions by China, I mean country, last year.

    imageimageimage

    The full 2018 year in review report can be found here.

    Image: CTBUH

  • Are you happy with where you live?

    This past weekend I saw a few people reacting on Twitter to this article by Wendell Cox talking about how Canadian families are being denied their preferred housing choice: the detached single family home.

    The fact that the article is by Wendell Cox should tell you everything you need to know. But essentially the argument is that misguided planning policies are driving up the cost of housing and that we should, instead, be encouraging unfettered sprawl.

    There’s lots to discuss here, but the first thought that actually came to mind was: “How would this article sound if we replaced all of the references to housing with references to cars?” In case you too are wondering that, this is how the first paragraph would read:

    A new poll by Sotheby’s International Realty suggests substantial disappointment among Canada’s young urban families, unable to afford to purchase the types of [cars] that they prefer. The poll determined that young urban households in Canada strongly prefer [Aston Martins], but they are often “motivated by (financial) necessity to purchases [sic] [cars], especially [BMWs], they do not prefer.“

    The article is clearly one-sided. I don’t disagree that there are people who – all things being equal – would prefer to raise a family in a ground-related single family home. Backyards serve a purpose, as do large basements equipped with beer fridges.

    But all things are not equal. And there also people who value walkability, a reasonable commute, and the kind of urban amenities that come along with being in a dense city. I am one of those people.

    Photo by Adrien Olichon on Unsplash