Daily insights for city builders, delivered every morning at 6 AM ET. I’m Brandon Donnelly — a Toronto-based real estate developer and founder of Globizen. I’ve been writing here since 2013.

Tag: urban core

  • Toronto is the densest urban area in North America

    Some of you are probably shocked by this headline. But it is true. Here’s the chart to prove it:

    Toronto is number one. Los Angeles is number two. And New York sits just behind Winnipeg and Calgary. Huh?

    The reason this is likely surprising to you is that when most people think of urban density they think of the urban core. And you are correct in thinking that the urban core of New York City is denser than the urban core of Winnipeg.

    The difference here is that we are talking about “urban area” (or “population centre” in Canada). This is the continuously built up area around each major city. Think of it as the lit up area that you might see on a nighttime aerial photo.

    Urban areas don’t care about municipal or other jurisdictional boundaries. And they don’t factor rural areas. Urban areas are a measure of continuous urbanization.

    So even if you have the densest downtown on the planet, if you have a sprawling low-density urban area surrounding it, you can still end up with a relatively low overall population density. And this is precisely what is happening here with New York.

    This is also why there’s only so much that you can glean from a blended average like this. Because you can have very different urban forms and very different mobility splits (think New York City vs. Winnipeg), and still end up with somewhat comparable averages.

    Chart: New Geography
  • Centralizing in cities

    This is not all that surprising:

    It is not surprising for at least two reasons:

    • We knew that central banks would tighten the money supply at some point and that it would have a negative impact on asset prices.
    • Many of us believed that a lot of people were making a somewhat long-term decision (flee the city) because of something that would ultimately prove to be short-term dislocation (a ~2 year health crisis).

    So one of the things I think you can glean from Daniel’s tweet is that our best urban centers are resilient. Notwithstanding the fact that we have things like Zoom and previous pandemic-suffering generations did not, the core value propositions associated with centralizing in cities hasn’t gone away.

  • The Great Recession only paused suburbanization

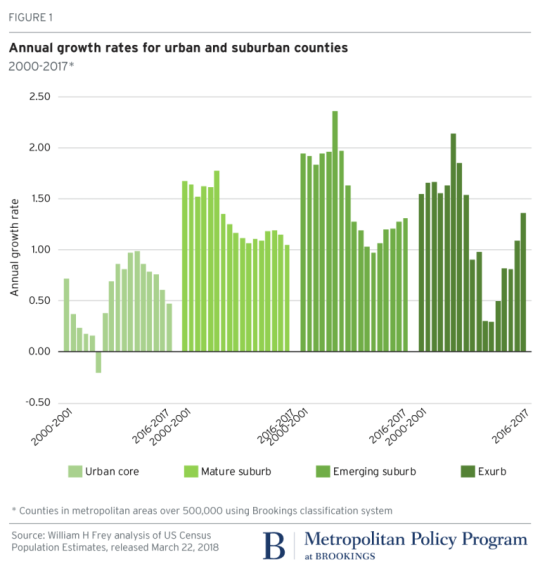
    According to newly released US census data for 2010-2017 – which Brookings analyzed here – the “back to the city” movement appears to have peaked in 2012. (This is something that we’ve looked at before on the blog.)

    Here is a graph from Brookings showing the annual growth rate for urban and suburban counties. Note how growth in the “urban core” peaked in 2012 and how growth in both the “emerging suburb” and “exurb” have increased since then.

    image

    The other finings from Brookings are that growth has slowed in large metropolitan areas (small metro areas and non metro areas, on the other hand are up) and that people are continuing to move from the Snow Belt to the Sun Belt.

    If you look at population gains and losses from 2016-2017 for the 100 largest US metro areas, the only Snow Belt gainers within the top 20 are New York (15th), Columbus (19th), and Boston (20th). Dallas, a Sun Belt city, was first with a gain of 146,000 people.

    So what’s going on? The narrative is that soon as the US economy and housing market recovered from the Great Recession of 2008, the trend lines simply reverted back to business as usual: sun and sprawl.

  • The top 10 most suburban cities in America

    According to NewGeography, ~85% of the population in the 53 major metropolitan areas in the U.S. lives in the suburbs or the exurbs. (Data from 2011-2015.) And according to some definitions, a number of these cities could be classified as being 100% suburban.

    NewGeography recently looked at America’s most suburbanized cities using the “City Sector Model” of classification. Here’s generally how it works:

    1. Urban core-CBD: Employment density > 19,999 people per square mile
    2. Urban core-inner ring: Population density > 7,499 per square mile and > 19.9% transit/walk/bike modal split
    3. Earlier suburb: Not urban core or exurb, and median year house built before 1980
    4. Later suburb: Not urban core or exurb, and median year house built after 1979
    5. Exurb: Outside of 2010 principal urban area or under 250 people per square mile 

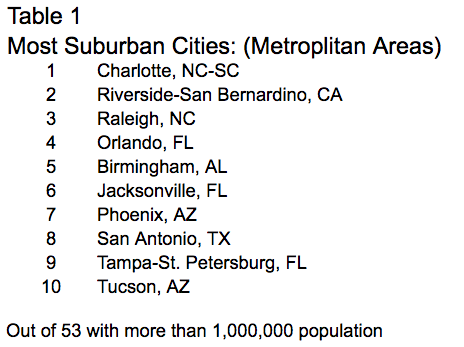
    Based on the above criteria, here are the top 10 most suburban cities in America:

    image

    All of these cities have virtually no urban core. To break the 10 way tie, they were simply sorted based on the size of their exurban population. To see all 53 metropolitan areas, click here.