Daily insights for city builders, delivered every morning at 6 AM ET. I’m Brandon Donnelly — a Toronto-based real estate developer and founder of Globizen. I’ve been writing here since 2013.

Tag: sustainability

  • How will climate change affect our coastal cities?

    One of the reasons New York is the city it is today is because of the superiority of its port. For a number of reasons, which are better explained here by urban economist Edward Glaeser, New York was almost destined to become “America’s port.” Of course, this phenomenon is something that has been repeated all throughout history. Being connected to the right body of water, in the right way, has meant all the difference in terms of economic success.

    But with study after study demonstrating that our economic success is leading to severe climate change and to the melting of arctic ice sheets, those very same port cities are now being put at serious risk. How ironic. Hurricane Sandy was the largest storm surge in the history of New York. Prior to it occurring, the likelihood of such a storm would have been calculated at 0.1%. It was greater than a 1,000 year storm.

    But if the research is correct, we’re going to see more storm surges and we’re going to see rising sea levels. This makes many, if not all, sea port cities a high risk zone for flooding, which is why cities, such as Boston, have prepared comprehensive reports on how to manage a rising tide. From adjustable parapet walls to multipurpose green spaces that can absorb excess water levels, cities around the world are looking for solutions.

    But these are merely reactive solutions.

    What need to also be looking at is how we can fundamentally improve our economy so that we’re operating in a sustainable way. Some of the research suggests that what we’ve done is irreversible, but that doesn’t mean we should continue to make it any worse. Part of the issue with this “wicked problem” is that it doesn’t seem immediate to most people, yet. It’s too easy to ignore. But that doesn’t mean it doesn’t exist.

    Image: This Big City
  • 80% of New York’s 150 million taxi trips could be shared

    I’ve been a big fan of MIT’s Senseable City Lab since I was a grad student at Penn. Their work sits at the intersection of cities and technology, and so I’ve always found it incredibly fascinating.

    Recently, the lab examined data from all of New York’s 13,586 registered cabs and looked for ways that technology and mobile tech could potentially optimize the way the system works today. In particular, they were interested in examining instances where people were heading to the same place at the same time, and were within no more than a 3 minute walk of each at the start of the trip.

    What they found was that, of the 150 million taxi rides taken in New York City during 2011, almost 80% of them could have been shared.

    That is, 80% of the time, there was an overlap in both time and route. That’s an hugely interesting stat because it starts to show just how much waste and inefficiency there currently is in the system. Think about all the trips and carbon emissions that could be potentially eliminated through optimization.

    Here’s a video they produced on the project. Click here if you can’t see it below.

    [youtube https://www.youtube.com/watch?v=Gyq_Zr96uzs?rel=0]

    It’s a great example of how technology is and will continue to creep into every segment of the economy. It’s exactly what I was talking about in my post, “Disrupting everything.”

  • Mapping public transit travel times

    image

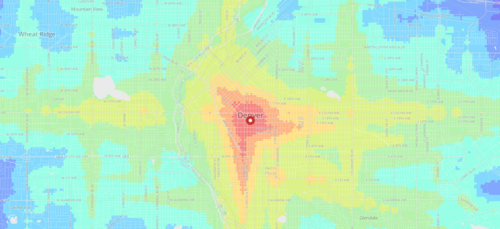
    I just came across an interesting web app created by geographer and programmer Andrew Hardin that maps public transit travel times for San Francisco, Seattle, Boulder and Denver.

    The app allows you to click on a location within one of these cities (or enter an address) and then receive a visual representation of travel times from that location.

    Both public transit and walking are factored in, and the fastest of the two is then modeled. The public transit data is taken from each respective authority and is similar to the data used by Google Maps.

    With these sorts of applications, I always wonder what it might look like overlaid with additional data points, such as home prices. Intuitively I would expect the best connected neighborhoods to also have some of the highest real estate values.

  • Pick one or the other

    Two days ago I posted a neat interactive map of carbon footprints across America. It was taken from an Atlantic Cities article. But in the same post, I questioned the (Atlantic Cities) article’s headline and main assertion that increasing population density won’t help to curb greenhouse gas emissions.

    This didn’t make sense to me.

    Well it turns out that the supporting research data was slightly misinterpreted. According to the Per Square Mile blog, the UC Berkeley study associated with the interactive map reveals a more nuanced relationship between population density and carbon emissions. It turns out that people who live in the middle of nowhere (rural residents) actually have fairly low carbon footprints. Even though they’re reliant on cars, they tend to drive and consume relatively little.

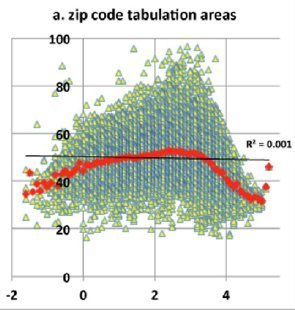
    And so initially, as population densities increase, so do carbon footprints. That is until it reaches about 3,000 people per square mile. At that point, carbon emissions start to drop off dramatically—roughly 35% on average from suburb to city.

    Below is a graph I found in the comment section of the original Atlantic Cities article that demonstrates this phenomenon. Population density is on the x-axis and carbon emissions are on the y-axis.

    image

    So here’s the big takeaway. If you’re looking to optimize around your carbon footprint, you need to pick a side: Either be urban or be rural. But don’t be somewhere in the middle. Don’t be suburban.