Daily insights for city builders, delivered every morning at 6 AM ET. I’m Brandon Donnelly — a Toronto-based real estate developer and founder of Globizen. I’ve been writing here since 2013.

Tag: singapore

  • The sensing power of taxis

    The latest project out of MIT’s Senseable City Lab examines the “sensing power of taxis” in various cities around the world. Looking at traffic data, they determined how many circulating taxis you would need to equip with sensors if you wanted to capture comprehensive street data across a particular city. This might be useful if you wanted to measure things like air quality, weather, traffic patterns, road quality, and so on.

    What they found is that the sensing power of taxis starts out unexpectedly high. It would only take 10 taxis to cover 1/3 of Manhattan’s streets in a single day. However, because taxis tend to have convergent routes, they also discovered rapid diminishing returns. It would take 30 taxis (or 0.3% of all taxi trips) to cover half of Manhattan in a day, and over 1,000 taxis to cover 85% of it. A similar phenomenon was observed in the other cities that they studied: Singapore, Chicago, San Francisco, Vienna, and Shanghai.

    However, if you look at the percentage of trips needed to scan half of the streets in a city, Manhattan has the lowest rate at 0.3%. Vienna is the highest at 9%. But I’m not sure if this is a function of the utilization rate of their taxis or if it has something to do with urban form. Singapore has a similarly low rate (0.44%), but its street grid looks nothing like that of New York’s.

    Here’s a short video explaining the project:

  • The coldest and hottest global cities

    Below is a list of the 44 cities found in the 2018 Global Power City Index by the Mori Memorial Foundation’s Institute for Urban Strategies.

    The index ranks the major cities of the world according to their “magnetism”, which they generally define as a city’s ability to attract people, capital, and businesses from around the world.

    As with all rankings, the output depends entirely on the methodology that you use. The GPCI seems to have the right executive committee in place. It includes global city authorities like Saskia Sassen. But that’s not really the point of today’s post.

    Beside each city, I have added the average highs and lows (in celsius) for both the coldest and hottest months of the year. For cities in the northern hemisphere, these are typically January and July/August, respectively.

    I have also added the spread between the hottest and coldest months to get a sense of variability. I always find it interesting to see how cities like Singapore, Kuala Lumpur, Jakarta, and Mumbai basically stay the same temperature all year round.

    When you look at this list, remember that you can ski in Dubai.

    All weather data taken from the NOAA (National Oceanic and Atmospheric Administration).

  • Average January temperatures by global city

    In Edward Glaeser’s book, Triumph of the City, he argues that the average temperature in January is the single best variable to predict which U.S. cities have grown the most over the last century. Indeed, from July 2015 to July 2016, 10 of the 15 fastest growing large metro areas in the U.S. were in the south. Follow the sun and sprawl.

    Given this phenomenon, I thought it would be interesting to look at the world’s most influential cities (i.e. global cities) through this lens. Because let’s face it, New York and London aren’t all that warm in January. 

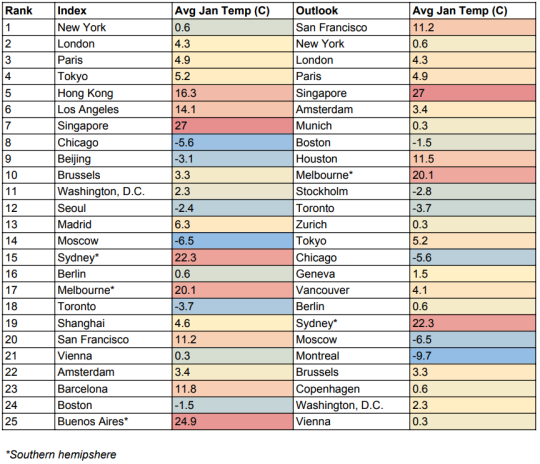
    Below are the top 25 global cities (taken from A.T. Kearney’s 2018 Global Cities Report), along with their average January temperature (taken from here). Note, there are two rankings. On the left is their global cities index. And on the right is their global cities outlook, which evaluates current potential. Cities that improved their economics & governance made the biggest leap on the right.

    image

    First of all, it’s interesting to see San Francisco jump so significantly in their outlook ranking. This has everything to do with tech and innovation. It’s also important to note that a handful of the above cities are located in the southern hemisphere, so “average January temperature” doesn’t mean the same thing (probably should have normalized to their winter).

    Montreal wins the award for the coldest city in this ranking. And there’s really only one city, Singapore, with a tropical climate. Though there are others, such as Hong Kong and Sydney, that would fall under subtropical. All of this isn’t enough for us to start inferring anything, but perhaps colder and more temperate climates aren’t such a bad thing for economic growth.

  • City-states and superstar cities

    During the recent election here in Toronto, mayoral candidate Jennifer Keesmaat raised the idea of this city region, maybe, becoming its own province. It wasn’t the first time this idea has been floated, but it once again didn’t stick.

    Earlier this week, Richard Florida spoke at the Urban Land Institute’s Toronto symposium and he brought up a similar issue: Toronto is a ‘city state’ and needs to start acting like it. Here is an excerpt from a recent Star article about his talk:

    He also noted that in terms of total economic output, the GTA [Greater Toronto Area] — he included the Golden Horseshoe — is responsible for about “$700 billion” (U.S) in economic output.

    “Which means our … region is equivalent to that of Sweden. So we are a city state, a mega region.”

    He later added: “we are a powerful global city with lots of assets to build on,” he said.

    But he went on to say that despite all of these successes there’s a “sense that something is amiss, something is wrong.”

    I have long supported the notion that city regions need to see and think of themselves as one united and contiguous economic landscape. In our case, it is not about, for instance, Hamilton vs. Toronto. This is about our entire region vs. New York or Singapore (a city-state) or the Pearl River Delta megalopolis.

    The headlines coming out of Amazon’s recent announcement are clear: In Superstar Cities, the Rich Get Richer, and They Get Amazon. This is winner-take-all urbanism where you need to be a “superstar” in order to compete. 

  • How Singapore fixed its housing problem

    There are a number of affordable housing plans being thrown around in Toronto right now given that we have a municipal election coming up this fall. 

    From what I have read, the plans are largely centered around surplus and/or available public land and possibly some subsidies. 

    These subsidies are very important because the money has to come from somewhere. This is often overlooked.

    In light of these debates, I thought I would share a short Bloomberg video that my friend Evgeny shared with me this morning all the way from Tokyo.

    The video is about how Singapore fixed its housing problem. If you can’t see it embedded below, click here.

    [youtube https://www.youtube.com/watch?v=2cjPgNBNeLU?rel=0&w=560&h=315]

    It strikes me as being very Singaporean.

  • Downward pressure on parking supply

    There’s a significant amount of downward pressure on parking supply in most major cities. Part of this has to do with the push toward more sustainable forms of transport, which is, of course, a good thing. But it also has to do with rising construction costs, the fear of obsolescence in the wake of autonomous vehicles, and probably many other factors.

    Developers, ourselves included, have responded by being cautious about the amount of parking being provided and by considering alternative future uses for the parking that is being built. I think it is also obvious that we will continue to see more, rather than less, parking stackers and other more efficient parking solutions.

    So far the cost of parking in dense urban centers has continued to rise. A new parking spot in the core of Toronto priced at $100,000 would not surprise me. And Hong Kong recently set a record for what is allegedly the most expensive parking spot in the world: USD 765,000 or CAD 1 million.

    But what is going to happen going forward?

    Researchers at the Singapore – MIT Alliance for Research and Technology and MIT Senseable City Lab, along with Allianz, have recently tried to quantify what the impact of autonomous vehicles will mean on required parking, and on traffic, in Singapore. The study is called Unparking.

    Today, they estimate the total number of parking spots in Singapore to be around 1,370,000. This is based on minimum parking requirements from the Housing Development Board and on the idea that home-work commuting consumes two parking spots: one at home and one at the office.

    They model four different scenarios, but the last one is based on fully autonomous vehicles and on shared parking spaces. Holding current mobility demands and traffic volumes constant, the demand for parking in this scenario drops by 70%.

    It is possible to reduce the number of parking spaces even further to 85%, but this has a negative impact on traffic congestion in their model. Fewer parking spaces means the autonomous vehicles have to drive around more picking people up. 

    I also don’t know if there was any consideration given to induced demand as a result of the more affordable autonomous vehicles. Demand for transportation services is generally thought to be fairly elastic.

    Whatever the case may be, numbers are made to be questioned. And Singapore is a unique city-state. But ¼ the amount of parking does not seem that far fetched to me.

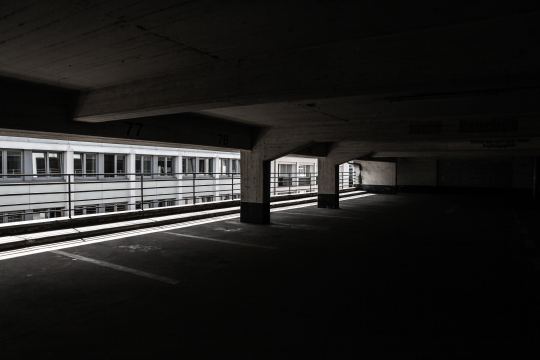
    Photo by Tobias Jussen on Unsplash

  • The 2018 Henley Passport Index

    image

    I still have every passport that I have ever owned. The older ones are far more interesting because I was younger and always looking for creative ways to travel around the world. The older I get the less interesting my passports get. Now I find it difficult to travel away from my desk at lunch.

    Passports are highly symbolic to me. It equals a particular kind of freedom. But I suppose that’s because I have a pretty good passport. 

    According to the 2018 Henley Passport Index, the Canadian passport is tied for 5th – along with Switzerland, Ireland, and the United States – in terms of the number of countries you can access without a visa. 176 countries in total.

    The highest ranking countries this year are Japan and Singapore. With those passports you have visa-free access to 180 countries. The last place country, at 105th, is Afghanistan. You get 24 countries.

    Switching to design – because that matters – I think you would be hard-pressed to find better looking ones than the new Norwegian passport (pictured above and set to be put into circulation later this year) and the Swiss passport. The Swiss passport is allegedly the first to be professionally designed.

    How does your passport fare on the Passport Index?

    Image: Dezeen

  • 2017 year in review

    I just finished going through my list of 2017 goals. I didn’t accomplish everything I wanted to, but I did manage to check off a number of professional and personal goals.

    Some of the remaining goals have been pushed to 2018. But there are also items that I have since realized aren’t worth pursuing and so I have dropped them from the list.

    All that said, it was a great year. Here is a rapid-fire summary of 2017 told through posts from this blog.

    Thanks for reading. Onward my friends.

  • How technology might transform health care

    Below is an interesting podcast with venture capitalist Bill Gurley talking about how technology might transform and improve health care.

    Based on their discussion, the US spends about 17-18% of GDP on health care. In most Western European countries and in Canada, it’s about half of that.

    In Singapore, it’s only 4% of GDP and there doesn’t appear to be any demonstrable differences in terms of health outcomes.

    If you can’t see the podcast embedded below, click here.

    https://art19.com/shows/the-ezra-klein-show/episodes/5bef0efc-97ce-412b-89dc-cb5d9d476f6f/embed?theme=dark-blue

  • 738,000 single-family homes were built last year in the US

    The New York Times recently published “a portrait of new single-family homes” in the US in 2016. Here’s that portrait:

    For those of those living in dense urban centers, this portrait is perhaps a reminder that in many other places a large single-family home can be had for about the price of a studio apartment.

    Nothing in the above portrait likely surprised you, but it’s interesting to note that over half of all new single family homes delivered last year were in “The South.” Only 7% were built in the dense northeast.

    The New York Times also recently looked at “international rents per square foot” using data from RentCafe. Here they are:

    New York City sits at the top with an average rent of $4.98 psf. This is across all boroughs. I am surprised by how low some of these international rents are. But averages rarely tell you the whole story.

    In any event, I do think that these two graphics start to speak to the economic spikiness that we are seeing across the US.