Daily insights for city builders, delivered every morning at 6 AM ET. I’m Brandon Donnelly — a Toronto-based real estate developer and founder of Globizen. I’ve been writing here since 2013.

Tag: san jose

  • US cities with the most corporate HQs

    The University of Toronto School of Cities recently looked at the changing economic geography of Fortune 500 companies across the US from 1975 to 2017. Here is a diagram of the results taken from CityLab:
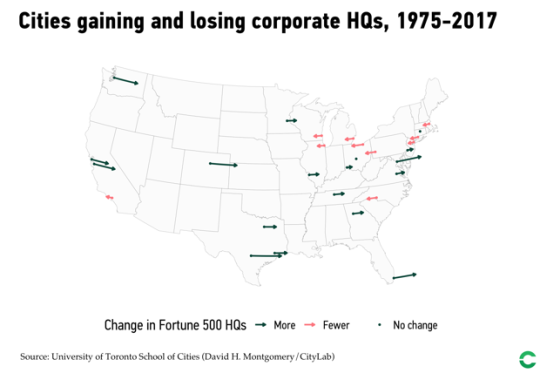
    New York sits at the top with 70 corporate headquarters as of 2017. But the San Francisco Bay Area is now the second largest center with 35 headquarters – a testament to tech.

    The study does, however, omit service firms, as these weren’t tracked in Fortune’s list back in 1975.

    Also noteworthy is the specialization that has taken place across specific cities and regions. Here is another excerpt from CityLab:

    America’s headquarters geography reflects the substantial variation and specialization of the U.S. economy. New York leads in finance and business services, consumer services, and goods and materials. But Houston leads in energy, San Jose in tech, and Chicago in retail and wholesale. Chicago also ranks second in consumer services, and goods and materials, and Dallas takes third in energy. Other cities like Nashville and Minneapolis take third in consumer services, and goods and materials, respectively.

    The full article can be found, here.
  • Winner take all

    We have talked a lot on this blog about the concentration of economic activity in global cities. Here is an old post about a paper called “winner-take-all-cities”, which documents the overrepresentation of talent, economic activity, innovation, and wealth creation in a select number of alpha cities.

    But this same phenomenon is playing out in a myriad of different ways. Aaron Renn calls this the “superstar effect” and has been writing about it for years. Another more recent example is this post by Richard Kerby called: Where did you go to school?

    Kerby looked at where venture capitalists in the US went to school and discovered that around 40% of them have gone to one of two schools: Stanford or Harvard. His argument is that not only is the venture capital industry lacking in gender and racial diversity, but it’s also lacking in cognitive diversity.

    My point with this post, though, is one of hyper-concentration. Tech is a dominant force in today’s economy. And in 2017, nearly 45% of all venture capital investment in the US went to companies located in the Bay Area – meaning San Francisco and San Jose.

    So here is an example of a select number of schools training a select number of minds that then go on to invest in a select number of cities. Fred Wilson, who is a venture capitalist, has a good response to this problem of diversity in the VC industry.

    But, of course, this is bigger than just the VC business.

  • How large metro areas are driving the global economy

    “The concentration of economic growth and prosperity in large metro areas defines the modern global economy, creating both opportunities and challenges in an era in which national political, economic, and societal trends are increasingly influenced by subnational dynamics.” -Brookings Institute

    The Metropolitan Policy Program at the Brookings Institute has a new report out for 2018 called the Global Metro Monitor.

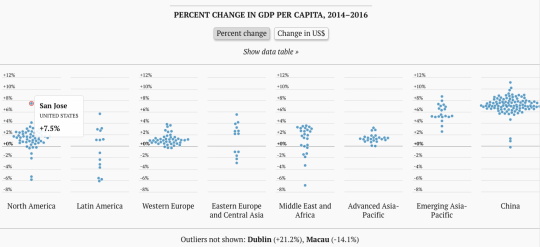
    Here are some of the highlights (data is from 2014 to 2016):

    – The 300 largest metro areas in the world accounted for 36% of employment growth and 67% of GDP growth.

    – Metro areas in China and the Asia-Pacific region outperformed, whereas Latin American cities, and in particular the largest Brazilian cities, were weaker performers.

    – The majority of large metro areas had growth rates that exceeded that of their respective regions. So again, cities are the driver.

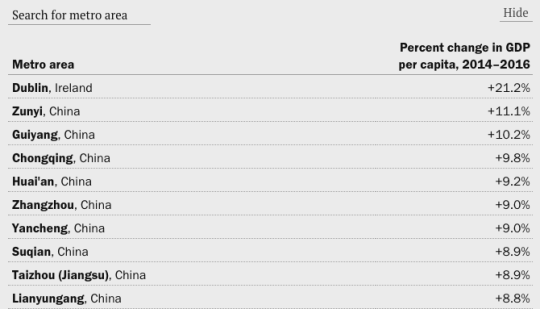
    And here is an interesting interactive chart (better to click through) that shows the % change in GDP per capita. 

    image

    Look at how much of an outlier San Jose is. Though, check out Dublin in the footnote. And if you look at the actual data table, it is all China, except for Dublin at the top.

    image

    For the rest of the charts, click here. And to download the full Global Metro Monitor report, click here.

  • Top US metro areas for VC investment

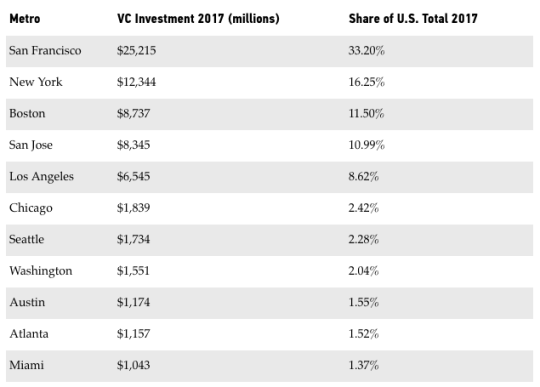
    Below is a list of the US metro areas that saw a billion dollars or more in venture capital investment last year (2017). It is taken from a recent CityLab article by Richard Florida where he talks about the “geographic inequality of high-tech venture capital.”

    image

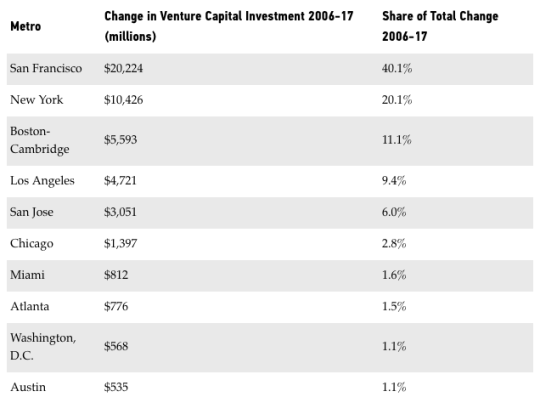
    It’s worth noting that San Francisco – not San Jose (Silicon Valley) – is at the top of the list with nearly 1/3 of the US total last year. It’s also interesting to note that when you look at each metro’s share of the total change from 2006-2017 (the chart below), you get Los Angeles now punching above San Jose. 

    image

    Florida also gets into which economic and demographic variables seem to be associated with higher levels of venture capital investment. For the rest of the article, click here

  • Land use restrictions and upward mobility

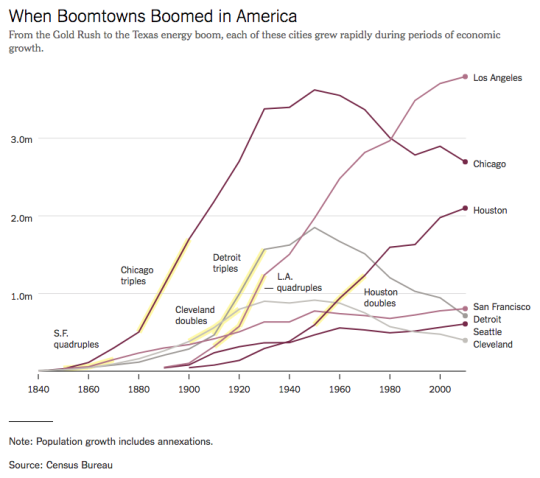
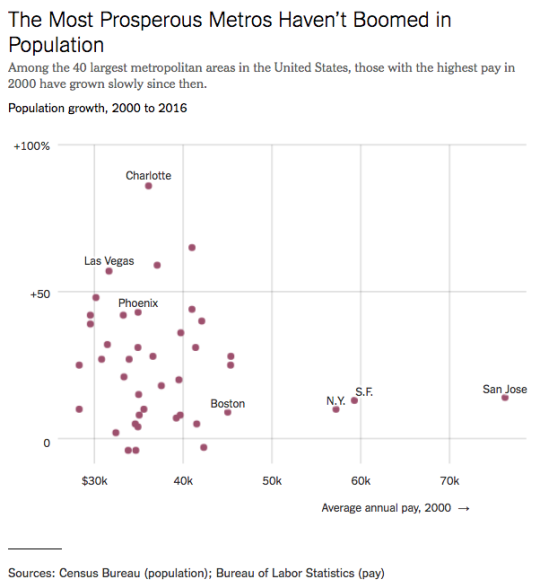
    Throughout US history, economic growth has typically spurred an “enormous reallocation of population.” Here is a graph from a recent New York Times article called: What Happened to the American Boomtown?

    The argument, here, is that restrictions on development have made it so that the most prosperous cities are actually the slowest growing cities in terms of population. Here is a chart, from the same article, comparing population growth to average annual pay:

    And here is an excerpt:

    But these productive places aren’t growing as fast now as economists believe they should — and as they would if they didn’t impose so many obstacles on new development. Since the 1970s, land use restrictions have multiplied in coastal metros, making it harder to build in, say, San Jose, Calif., than in Phoenix. And the politics of development have become tense, too. In the Boston suburbs, the Bay Area, Brooklyn and Washington, people who already live there have balked at new housing for people who don’t.

    We often talk about the impact of land use restrictions on supply and overall housing affordability. But here is an argument that it could also be impacting upward mobility.

  • Crane capital of America

    When people like Richard Florida talk about today’s “superstar cities”, the usual suspects include London and New York for finance, the San Francisco Bay Area for tech, Milan for fashion and design, and so on.

    And you can certainly find the data to back up these claims. For instance, if you look at venture capital dollars invested, many of these same cities reappear near the top: San Francisco, San Jose, New York, etc.

    One city that doesn’t often appear on these sorts of lists, though, is Seattle. 

    However, clearly something special is taking place in the city. For the second year in a row, Seattle has been named the construction crane capital of America. No other American city comes close right now. (However, Toronto is still #1 in North America.)

    At the same time, if you think about all of the companies that have come out of Seattle over the years, you start to realize that maybe VC dollars invested isn’t enough to tell the entire entrepreneurial story.

    Venture capitalist Fred Wilson once said on his blog that if you look at dollars in and dollars out, Seattle outperforms – by a lot. And that’s very interesting to me. Is this simply the lasting legacy of Microsoft? Or are there other – transferable – lessons to be learned here?

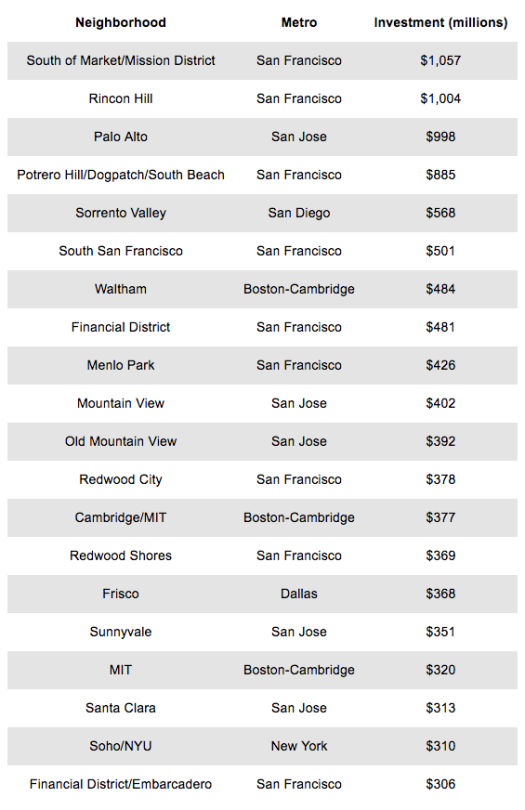
  • The top 20 US neighborhoods for venture capital investment

    There’s a lot of talk about how venture capital investment has shifted from the suburbs to cities and how it is also concentrated in certain metro areas. But a new report from the Martin Prosperity Institute has dug even deeper to look at the top 20 neighborhoods (zip codes) in the US for venture capital investment.

    Here’s a summary of what they found:

    “The top 20 neighborhoods or zip codes for venture investment include nine in San Francisco, five in San Jose, three in Boston-Cambridge (one in suburban Waltham and two in Cambridge close to MIT) and one each in San Diego (close to the University of California, San Diego), Dallas, and New York (close to New York University).”

    And here’s the full top 20 list:

    image

    Initially I looked at this list and thought that neighborhoods such as Menlo Park and Redwood City shouldn’t be labeled as San Francisco, since they are outside of the county. But technically they still fall within the San Francisco Metropolitan Area

    It’s amazing how San Francisco dominates this list.

  • Top 10 (US) cities for young smart people

    image

    I’m always on the lookout for great websites and communities dedicated to cities. And today, thanks to a friend of mine, I found a new one called City Observatory. It’s my new favorite site for city geeks.

    They describe themselves as a “data-driven platform for sharing, analyzing and discussing the success of cities.” As soon as I read that, I immediately subscribed. I’m a big believer in using data to elevate the discussions happening around our cities and to cut through the bullshit.

    I’m looking forward to digging into more of their articles, but I did already take a look at the first report they published, which is called: “The Young and Restless and the Nation’s Cities”. Click here to download the PDF.

    What the report talks about is a demographic group that they refer to as “Young and Restless”, and which they define as being 25-34 years old and having a 4-year degree. And they focus on this group because they see it as critical to driving local economic development.

    They’re the next generation who are going to start those companies and drive growth and innovation. And since the data shows that as people age, they become less willing to relocate (which intuitively makes sense), cities today are quickly realizing that they need to capture this group of smart people while they’re still restless (i.e. mobile).

    So if this is important, which cities (in the US) are winning right now? Here are the top 10 cities via City Observatory:

    1. Washington D.C. 8.1%
    2. San Francisco 7.6%
    3. Boston/Cambridge 7.6%
    4. San Jose 7.5%
    5. Denver 7.5%
    6. Austin 7.0%
    7. New York 6.6%
    8. Minneapolis 6.6%
    9. Raleigh 6.5%
    10. Seattle 6.1%

    The percentage represents the portion of the population that’s 25-34 years old and has a 4-year degree. I’ve just listed the cities here, but in reality they reference the entire metro areas.

    Do any of the cities on this list surprise you? None are surprises for me. It’s more or less what I would have expected to see, except maybe for the absence of Chicago (it’s 12th according to this ranking).

    Is your city doing enough to capture this group?

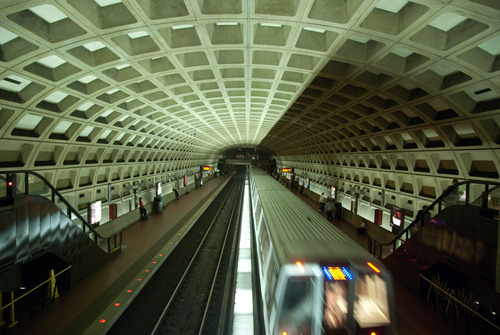
    Image: Flickr