Daily insights for city builders, delivered every morning at 6 AM ET. I’m Brandon Donnelly — a Toronto-based real estate developer and founder of Globizen. I’ve been writing here since 2013.
Back in the spring, I wrote about a study that was done by the University of Toronto and the University of California, Berkeley that measured “downtown recoveries” using mobile phone data.
In other words, it looked at where people’s phones were lingering to try and determine if they were back in the office and doing things downtown.
The headline finding was that San Francisco had the lowest recovery quotient (RT) and that Salt Lake City had the highest, alongside cities like San Diego, Baltimore, and Bakersfield.
But why was there such a spread in recoveries?
One possible explanation was commute times. The cities with the lowest average commute times seemed to generally perform better in this study and have higher recovery quotients. But it’s maybe more nuanced than this.
Here is a recent Brookings article by Tracy Hadden Loh that looks at this same study. And to give just one example, she notes that San Diego’s airport happens to fall within the same zip code as its downtown. Meaning, airport traffic would have been picked up as downtown traffic.
The article also includes the above chart, showing the amount of downtown apartments built since 2019. I don’t think I knew that Chicago was so prolific.
The University area is one of 53 community planning areas in the City of San Diego. And this one, as the name suggests, houses the University of California, San Diego (UCSD), which is at the northern end of the blue transit line.
The last time the University Community Plan was updated was in 1987, and so it’s an old plan and it is currently being redone to better align with the City’s current strategic plan — which includes things like “creating homes for all of us” and “championing sustainability.”
The final draft community plan won’t be available until later this year, but there are two draft scenarios available for download. Here’s what Scenario A looks like:
The “T” circles are transit stops on the Blue Line (which runs south to downtown and then to the Mexico border), the olive green areas are institutional (UCSD, hospital, etc.), and the purple areas are “urban villages” with densities that go as high as 218 dwelling units per acre (darkest purple). For the other areas, please refer to the legend.
Now let’s put this residential density into some sort of context. One acre = 43,560 square feet. So we’re talking about 218 homes on every 43,560 square feet of land. For context, our mid-rise Junction House project is 151 homes and our site area is approximately 22,000 square feet (about 0.5 acres). That puts us at roughly 302 homes per acre — more than what is proposed here.
In total the revised plan could allow for somewhere between 35,000 to 56,000 new homes in the University City area. Not surprisingly, the community has reacted by organizing rallies, such as this one, here, called “Honks against housing”:
(I used a screenshot because embedded tweets don’t seem to show up properly in my email newsletter.)
This is, again, not unexpected. And all of the typical things could be said about incumbent residents opposing new homes on top of an existing transit line, next to a major university. But what stands out to me about this protest is its format.
These residents are worried that high-rises will destroy their community. So presumably they are looking to get the word out to as many people as possible. And one of the ways they have decided to do that is stand on the side of a busy road and appeal to people in their cars.
Ironically, I think this actually reinforces the need for an updated Community Plan. Because it speaks to the car-oriented nature of this community and the need for better land use planning around its existing transit stations.
In my view, the line of thinking here should not be, “this is going to destroy our community. How will our roads ever accommodate 35,000 new homes?” It should be, “how do we better plan this community so that our next generation of residents have the luxury not to have to drive everywhere?”
If you’d like to offer constructive feedback on this plan, I’m told that you can email Nancy Graham at nhgraham@sandiego.gov.
San Diego-based Jonathan Segal is a unique kind of builder in that his firm doesn’t have any clients. They act as both the architect and developer for all of their projects. This gives them a lot of control over the building process, but also more freedom to experiment.
It’s a 5,000 sf corner site, and Segal developed it with 42 micro units (5 of which are priced at 65% of AMR), two retail spaces at grade, and a separate “single-family townhouse” for his son that sits on top of the retail space at the corner.
The idea was to create relatively affordable “workforce” housing, which is why there’s also minimal parking. The 37 market-rate units are currently priced between $1,595 and $1,995 per month, and the affordable ones are about $900 per month.
Segal is forthright in the interview in saying that leasing velocity was slow following completion in December 2019. It was hard to rent these kinds of units in San Diego without any parking. But he viewed the project as an experiment and eventually he did find product-market fit.
The mix of housing types here is also noteworthy. Presumably his son could have just gone out and built a more typical grade-related home. But why do that when you can build on top of an urban retail space and add 42 other homes to the lot?
Not surprisingly, their business as a travel company has been heavily impacted by COVID-19. Last year, the platform saw 326.9 million nights and experiences booked, with 251.1 million being booked in the first nine months of 2019. This year, nights and experiences are down to 146.9 million for this same nine month period. Revenue is correspondingly down from $3.7 billion for the first nine months of 2019, to $2.5 billion for the first nine months of this year.
But what is also clear from their data is that people still really want to travel and have new experiences. As soon as April passed and the Northern Hemisphere entered the normally busy Q3 travel season, domestic travel began to quickly ramp back up. For many, this likely took the place of international travel. See above chart.
Of greater concern might be all of the regulation that now surrounds short-term rentals. As of October 2019, about 70% of the platform’s top 200 cities (by revenue) had some form of regulation impacting short-term rentals. But at the same time, no one city accounts for more than 2.5% of the platform’s revenue. So there’s strong geographic diversification.
If you’d like to take a look at the company’s S-1, you can do that over here. And for those of you who might be curious, these are Airbnb’s top 10 cities based on revenue:
Witold Rybczynski’s recent blog post about architecture’s “curious business model” gets at one of the core challenges of new construction: “Every project is, in effect, a custom job; there are no real economies of scale.” There are also no reoccurring cash flows for the architect, Witold explains, unlike a writer who might earn ongoing royalties or a business owner whose wealth will grow as the business grows.
There are two items to discuss here: (1) The “curious business model” used in the practice of architecture and (2) the inefficiencies of construction.
The first one is not unique to architecture. You could say the same thing about the planning and real estate lawyers who also work on new buildings. But I take Witold’s point in that even a painter’s work could appreciate in value after it’s done, whereas there’s typically no mechanism for any of this to accrue (to the architect) in the world of architecture.
When I was young, I was told that there are two ways to make money. You can either trade your time for money or you can own assets that make you money. An example of the latter might be a farm where the tenant farmer pays you rent every month. You’re not trading your time by actually doing the farming, you just own the asset.
This may seem obvious, but it’s fundamental. And it’s one of the reasons why, when I was in architecture school, I admired the practices of people like Jonathan Segal out of San Diego. Jonathan is one of the pioneers of the “architect as developer” approach. He simply became his own client and started building his own projects.
Moving on to topic number two.
Everyone in the business of building new buildings is looking for repeatable methodologies. Many have thought: How do we make the construction of buildings more like the assembly of cars? How do we create a standardized kit of parts? And that has lead to longstanding efforts around prefabrication. Today, as you know, we are also looking at how 3D printing might make this easier/cheaper.
In some ways, that is happening. There are examples of prefabrication and panelization, and there are developers who are using this approach. (See H+ME Technology.) But for the most part, we still build on site and it’s still a messy process with lots of waste and inefficiencies. If there was a cheaper and more effective way to do it, the industry would certainly move in that direction. Eventually that will happen.
In the meantime, we will continue building our prototypes.
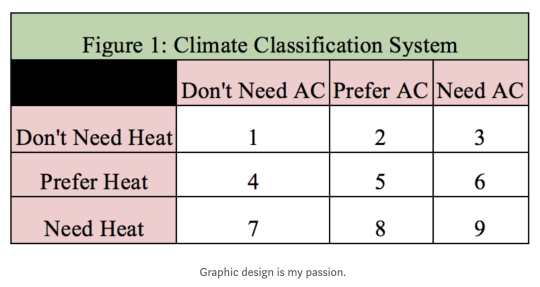
In his original study, Gray had 9 climatic categories, all of which were based on average high and low temperatures throughout the year. Category 1 was you definitely don’t need AC or heat. These cities are essentially perfect year round. And category 9 was you definitely need heat and AC. These cities are basically the worst places on earth to occupy from a climate perspective.
The climatic utopias ended up being places like Bogotá, Guatemala City, Lima, Mexico City, San Diego, São Paulo, and Sydney. The worst places were the southeastern United States, Central Asia, and northern East Asia.
But one factor that is not included in the study is humidity, which Gray rightly points out has a meaningful impact on comfort. Toronto, for example, is classified in his system as category 7. Heat needed. But AC definitely not needed. Personally, I would bump us up to category 8: AC preferred, but not needed.
Still, this is an interesting study. There are relatively few cities with so-called perfect climates. And I have always found these sorts of climates fascinating because they empower a very different kind of relationship to outside spaces.
I’ve been hearing a lot about Bird recently. Perhaps it has something to do with the $15 million Series A round they raised last month (February 2018) and the $100 million Series B round they announced earlier today.
A “Bird” is small electric scooters that look like this and can be rented from your phone for short haul trips. They are currently available in Santa Monica, Venice, UCLA, Westwood, and San Diego, and they are intended to be ridden in existing bike lanes.
What may be particularly interesting to this blog audience is the fact that Bird is calling itself a “last-mile electric vehicle sharing company.” The pitch: 40% of car trips (in the US?) are less than 2 miles long. Let’s replace those using electric scooters.
One of the first things that came to my mind is that this feels more accessible than cycling. Cycling to work can be a commitment. You have to think about your attire and the sweat factor, among other things.
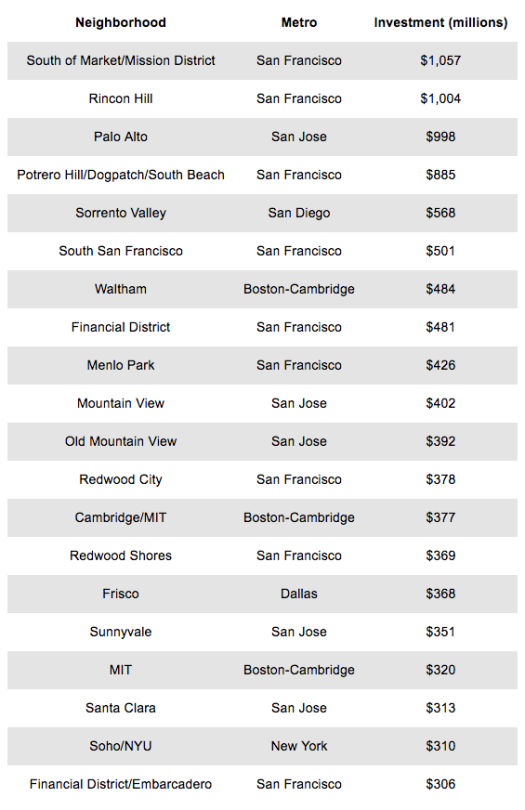
There’s a lot of talk about how venture capital investment has shifted from the suburbs to cities and how it is also concentrated in certain metro areas. But a new report from the Martin Prosperity Institute has dug even deeper to look at the top 20 neighborhoods (zip codes) in the US for venture capital investment.
Here’s a summary of what they found:
“The top 20 neighborhoods or zip codes for venture investment include nine in San Francisco, five in San Jose, three in Boston-Cambridge (one in suburban Waltham and two in Cambridge close to MIT) and one each in San Diego (close to the University of California, San Diego), Dallas, and New York (close to New York University).”
Initially I looked at this list and thought that neighborhoods such as Menlo Park and Redwood City shouldn’t be labeled as San Francisco, since they are outside of the county. But technically they still fall within the San Francisco Metropolitan Area.
It’s amazing how San Francisco dominates this list.
I first learned about the work of Jonathan Segal back when I was in architecture school. And he was somebody I immediately admired.
At the time, I was struggling to figure out where I wanted to position myself between architecture and real estate development, and he was somebody who had seemingly figured it all out: he simply merged the two.
For those of you who are unfamiliar with Jonathan Segal, he has made a name for himself by being a pioneer of the “Architect as Developer” business model. That is, he acts as both the architect and the developer/client.
This business model isn’t going to suit everyone, but I suspect that we’ll see more of it in the future.
Of course, it doesn’t just have to be an architect acting as a developer. It could also be an architect and a developer joining forces or some other permutation. Whatever the case may be, design and innovation are central to business today and that’s why I think this model will only become more relevant.
Below is a short 3 ½ minute video about Segal’s latest project, called Mr. Robinson. It is located in San Diego. If you can’t see the video below, click here.
[vimeo 155403927 w=500 h=211]
If you’d like to see the typical floor plans or rent one of the apartments (they start at $2,400/month), click here.
Now I’d be curious to hear your thoughts. Do you like the project?