Daily insights for city builders, delivered every morning at 6 AM ET. I’m Brandon Donnelly — a Toronto-based real estate developer and founder of Globizen. I’ve been writing here since 2013.

Tag: richard florida

  • Implications of new housing supply

    There’s a lot of debate within urbanist circles about whether or not supply alone can solve or at least mitigate housing affordability concerns. Richard Florida and others will say that, while beneficial, increasing supply isn’t the be all end all. We need to be building affordable housing.

    Edward Glaeser, Joseph Gyourko, and others have, on the other hand, argued that middle-income housing is a supply problem and that low-income housing is quite simply a demand-side problem, which could be solved through things like a housing voucher program.

    In other words, the cost of housing isn’t necessarily the problem, it’s the low income levels. One of the benefits of supplementing people’s incomes is that it empowers mobility. People can then move to where there are jobs, as opposed to being tied to a specific neighborhood or city.

    But this debate is arguably just about the extent of the supply benefits. Intuitively, it makes sense to try and match new housing supply with demand and economic growth. But how far can that take us, particularly in high demand and high productivity cities?

    Glaeser (Harvard) and Gyourko (Penn) have a relatively recent paper out called, The Economic Implications of Housing Supply, which looks at, among other things, the “implicit tax” imposed on development as a result of land use restrictions and other supply constraints.

    Here are two excerpts:

    We will argue that the rise in housing wealth is concentrated in the major coastal markets that have high prices relative to minimum production costs, and it is concentrated among the richest members of the older cohorts—that is, on those who already owned homes several decades ago, before binding constraints on new housing construction were imposed.

    But in a democratic system where the rules for building and land use are largely determined by existing homeowners, development projects face a considerable disadvantage, especially since many of the potential beneficiaries of a new project do not have a place to live in the jurisdiction when possibilities for reducing regulation and expanding the supply of housing are debated.

    If you’re interested in this topic (and sufficiently nerdy), you can download a PDF copy of the paper here.

    Photo by chuttersnap on Unsplash
  • Is this just how the game is played?

    As I am sure you have all heard, there’s a lot of debate in New York right now (city and state) about whether they should reject Amazon’s decision to open up a new headquarters in Queens.

    Urbanist Richard Florida has been arguing that one of the richest companies in the world shouldn’t be receiving taxpayer subsidies and that Amazon should do the right thing here. They should open up in New York but without any inducements.

    As a counter argument, Kenneth Jackson, professor of history at Columbia University, recently opined that this is actually business as usual. American cities have a long history of competing for companies because the benefits outweigh the costs over the longer term.

    Here is an excerpt from his op-ed in the New York Times:

    They are right about one thing. It is absurd that any city would agree to such a deal. But this is how the game is played. Paying companies to relocate has been the American way since 1936, when Mississippi established the nation’s first state-sponsored economic development plan. Under that plan, since followed by many other jurisdictions, cities and states agreed to pay companies to relocate by promising them new factories and low or nonexistent taxes. With those inducements, numerous businesses relocated in the decades after World War II, usually from the union-dominated Northeast and Midwest to the business-friendly South.

    Perhaps this would make a good debate topic for Kialo.

    Update: Amazon just cancelled its plans for a corporate HQ in NYC.

  • The geography of gyms

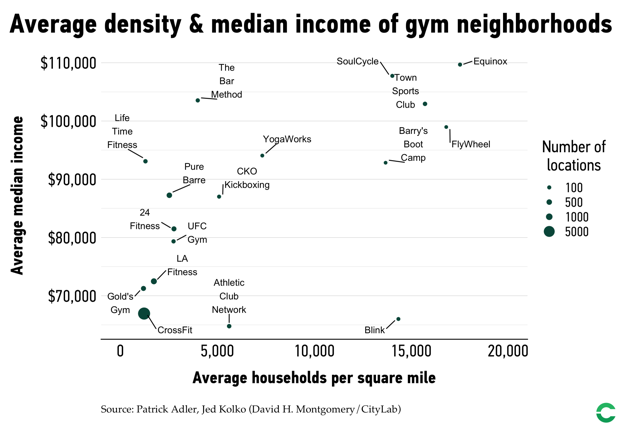
    Richard Florida and Patrick Adler recently looked at the geography of gyms across the United States. They analyzed 17 different fitness chains, over 10,000 gyms, and nearly 5,000 zip codes. Full article over here at CityLab.

    image

    The findings probably won’t surprise you, but it’s still interesting to see some of the data. Gyms and fitness studios tend to concentrate themselves in affluent neighborhoods with a high number of college graduates.

    The median household income of the average zip code with a gym or fitness studio is $72,720. This is compared to $56,694 for all zip codes. And when it comes to zip codes with an Equinox, SoulCycle, The Bar Method, or Town Sports Clubs, the median income jumps to over $100,000.

    Above is from the second post in the two part series they are doing on “the geography of fitness.” For the first one, click here.

  • US cities with the most corporate HQs

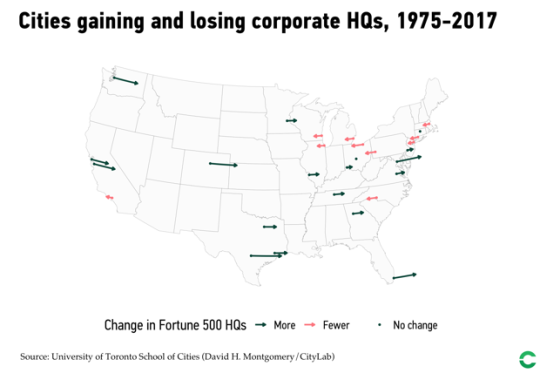
    The University of Toronto School of Cities recently looked at the changing economic geography of Fortune 500 companies across the US from 1975 to 2017. Here is a diagram of the results taken from CityLab:

    New York sits at the top with 70 corporate headquarters as of 2017. But the San Francisco Bay Area is now the second largest center with 35 headquarters – a testament to tech.

    The study does, however, omit service firms, as these weren’t tracked in Fortune’s list back in 1975.

    Also noteworthy is the specialization that has taken place across specific cities and regions. Here is another excerpt from CityLab:

    America’s headquarters geography reflects the substantial variation and specialization of the U.S. economy. New York leads in finance and business services, consumer services, and goods and materials. But Houston leads in energy, San Jose in tech, and Chicago in retail and wholesale. Chicago also ranks second in consumer services, and goods and materials, and Dallas takes third in energy. Other cities like Nashville and Minneapolis take third in consumer services, and goods and materials, respectively.

    The full article can be found, here.

  • City-states and superstar cities

    During the recent election here in Toronto, mayoral candidate Jennifer Keesmaat raised the idea of this city region, maybe, becoming its own province. It wasn’t the first time this idea has been floated, but it once again didn’t stick.

    Earlier this week, Richard Florida spoke at the Urban Land Institute’s Toronto symposium and he brought up a similar issue: Toronto is a ‘city state’ and needs to start acting like it. Here is an excerpt from a recent Star article about his talk:

    He also noted that in terms of total economic output, the GTA [Greater Toronto Area] — he included the Golden Horseshoe — is responsible for about “$700 billion” (U.S) in economic output.

    “Which means our … region is equivalent to that of Sweden. So we are a city state, a mega region.”

    He later added: “we are a powerful global city with lots of assets to build on,” he said.

    But he went on to say that despite all of these successes there’s a “sense that something is amiss, something is wrong.”

    I have long supported the notion that city regions need to see and think of themselves as one united and contiguous economic landscape. In our case, it is not about, for instance, Hamilton vs. Toronto. This is about our entire region vs. New York or Singapore (a city-state) or the Pearl River Delta megalopolis.

    The headlines coming out of Amazon’s recent announcement are clear: In Superstar Cities, the Rich Get Richer, and They Get Amazon. This is winner-take-all urbanism where you need to be a “superstar” in order to compete. 

  • The vertical city

    We often talk about agglomeration economies in terms of their horizontal clustering within cities. But a new paper in the Journal of Urban Economics – summarized here by Richard Florida – has looked at the other dimension: the vertical clustering of economic activity within tall buildings. 

    Here is an excerpt from Florida’s piece in CityLab:

    Economic activity is also sorted vertically, with higher-profile and more profitable firms occupying higher building floors. Law offices are disproportionately represented on the highest floors, taking up more than a third of floor space above the 40th floor, compared to 12 percent of floor space between the second and 40th floors. Finance, insurance, and real estate take up roughly 20 percent of floor space above the 40th floor, compared to 23 percent between the second and 40th floors. Business services, engineering, and miscellaneous other industries are also more likely to take up more space below the 40th floor.

    The other takeaway is that there appears to be a greater rent premium attached to higher floors (vertical movement) than for being located closer to the central business district (horizontal movement). This surprised me. But I also don’t have access to the full paper. Is the dataset just US cities?

    Nevertheless, the idea of a vertical city interests me a lot. And I agree with the authors of the report that, for perhaps obvious reasons, it is far less studied compared to horizontal development patterns.

  • Where are all the kids?

    This evening, when I was reading the internet, I came across this New York Times article from 2017 talking about how San Francisco has the lowest percentage of children of any of the largest cities in the U.S. It’s around 13% of the population. (Supposedly it was the second lowest in 2015. Pittsburgh was first.)

    The article goes on to claim that the city has approximately the same number of dogs as it does children. That number is somewhere around 120,000. Not surprisingly, many blame the city’s prohibitive housing costs as the main culprit for the lack of kids. Families simply cannot afford to live in the city.

    This got me searching for more information. Richard Florida looked at similar data back in 2015, but it’s important to note that he looked at metro areas and not the city propers. So the data doesn’t speak to whether families were forced to move out from the urban core to the suburbs in search of more affordable housing or for more space.

    Nevertheless, he finds no statistical association between the share of children in a city and things like urban density, economic output per capita, or median home prices. He instead finds that the share of children is positively correlated with two main factors: immigration and with ethnicity – specifically people of Latin origin.

    Click here if you’d like to read the rest of Florida’s analysis. And if any of you have additional data on this topic, please do share it below. I think I’m going to continue digging into this question of kids and cities.

    Image: Photo by William Bout on Unsplash

  • What’s Manhattan worth?

    I like looking at real estate values over longer periods of time because it helps to put things into perspective. 

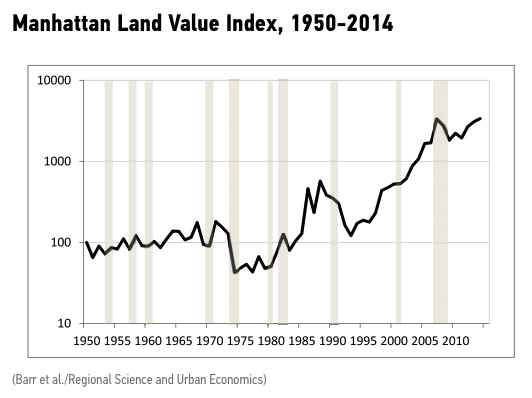
    Below is a land value index for Manhattan running from 1950 to 2014 that was recently created by economists out of Rutgers University.

    image

    The study was also cited in this recent article by Richard Florida.

    Here are some of the highlights from their study:

    We find three major cycles with land values reaching their nadir in 1977, just after the city’s fiscal crisis.

    Since 1993, land prices have risen much faster than population or employment, at an average annual rate of 15.8%.

    We estimate the entire amount of developable land on Manhattan in 2014 was worth approximately $1.74 trillion.

    We estimate the long run return to Manhattan land values [since the island was first inhabited by Dutch settlers in 1626] to be about 6.4%.

    What’s fascinating to me is the accelerated appreciation. The index starts at 100 in 1950, ends up slightly above that by 1993, and then simply takes off.

  • Top US metro areas for VC investment

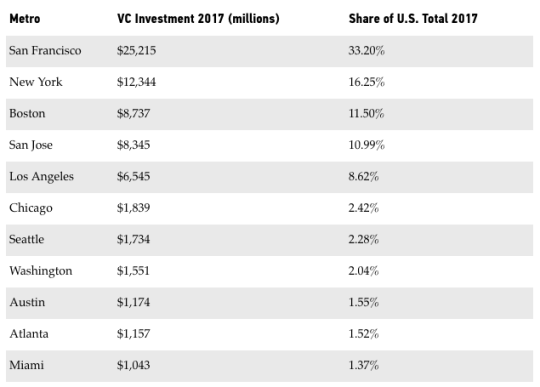
    Below is a list of the US metro areas that saw a billion dollars or more in venture capital investment last year (2017). It is taken from a recent CityLab article by Richard Florida where he talks about the “geographic inequality of high-tech venture capital.”

    image

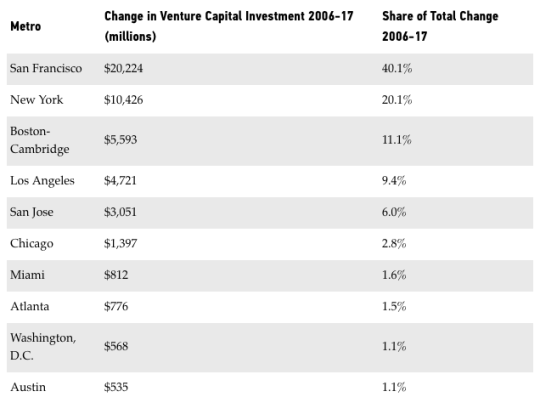
    It’s worth noting that San Francisco – not San Jose (Silicon Valley) – is at the top of the list with nearly 1/3 of the US total last year. It’s also interesting to note that when you look at each metro’s share of the total change from 2006-2017 (the chart below), you get Los Angeles now punching above San Jose. 

    image

    Florida also gets into which economic and demographic variables seem to be associated with higher levels of venture capital investment. For the rest of the article, click here

  • Winner-take-all cities

    Richard Florida, Charlotta Mellander, and Karen M. King have a new working paper out called Winner-Take-All Cities.

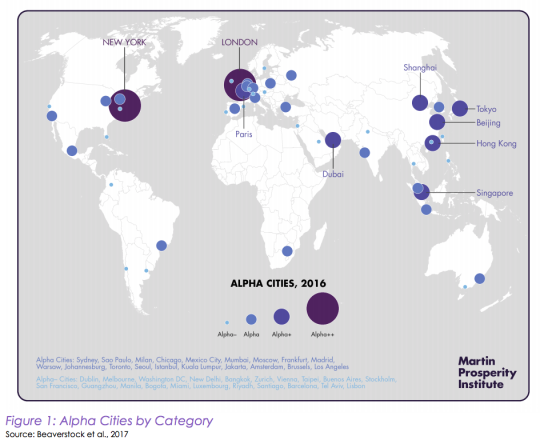
    It is about the phenomenon of “winner-take-all urbanism” and how a select number of alpha cities seem to overrepresent when it comes to talent, economic activity, innovation, and wealth creation.

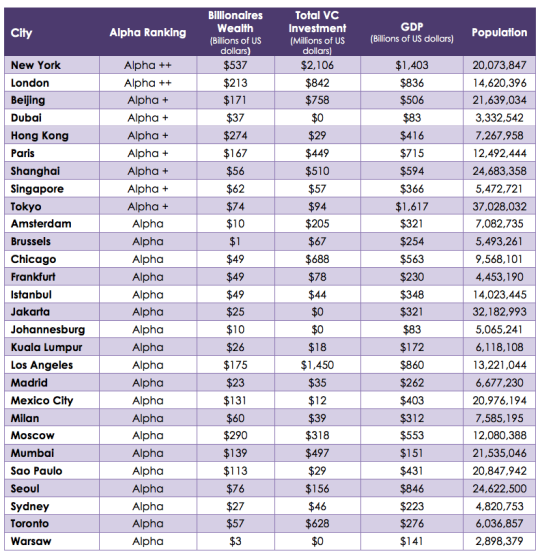
    In this study they look at economic output, innovation (venture capital-backed startups), and billionaire wealth in each city. They then compare these factors to the distribution of the population.

    Here are the Alpha cities they looked at:

    In some cases the above concentrations were multiples of what the city’s population would lead you to predict. Their conclusion: “We find clear evidence of a winner-take-all urbanism
    across the global economy and the world’s cities.”