Daily insights for city builders, delivered every morning at 6 AM ET. I’m Brandon Donnelly — a Toronto-based real estate developer and founder of Globizen. I’ve been writing here since 2013.

Tag: residential

  • A study on expanding housing options in Toronto

    The City of Toronto is currently studying ways to increase housing options/supply and planning permissions in areas of the city that are designated as Neighbourhoods in the Official Plan.

    These are areas that are sometimes referred to as the “Yellowbelt”, because they are seeing very little intensification and, in a number of cases, actually losing population. (They’re also colored yellow in Toronto’s land use map.)

    Ultimately, the goal is to encourage more “missing middle” type housing forms; housing that is denser than single-family homes but smaller in scale than say mid-rise housing like Junction House.

    Here are a couple of interesting charts from the City. Based on Toronto’s Official Plan, “Neighbourhoods” make up 35.4% of the city’s land area.

    In Toronto’s Zoning By-law, the “Residential” category makes up 47.1% of the city’s land area.

    Digging deeper, 31.3% of Toronto’s total area is zoned for only detached houses — which would mean no missing middle type housing. But 15.8% of the city’s total area is already zoned to permit other types of low-rise residential buildings, such as duplexes and triplexes.

    So why isn’t more of that happening?

    As we’ve talked about before on the blog, the problem is that it is exceedingly difficult to make the math work on projects of this scale, which is why most developers don’t want to do them. The web of bureaucracy that you need to navigate in order to build anything in the city is also imposing for non-developers (and developers really).

    But to be a developer, I think you need to be an optimist. So I am going to remain hopeful that this study — and the pilot they want to do in Ward 19 — will result in a streamlined solution for housing of this scale.

    Images: City of Toronto

  • OMA’s first ground-up project in Manhattan finishes construction

    121 East 22nd — which is OMA’s first ground-up project in Manhattan — recently finished up construction at the corner of E 23rd St and Lexington Ave (the site continues through to E 22nd St, where there is basically a 2nd building). I wrote about the project over two years ago, here.

    Below is a photo by Laurian Ghinitoiu, via Dezeen, of it completed:

    The defining feature is its “prismatic corner”, which, I understand from this interview with David Von Spreckelsen (President of Toll Brothers City Living), was largely an outcome of the site’s restrictive zoning. There was a requirement to have constant street walls. That minimized what could be done architecturally on the project’s main elevations.

    The solution is two contextual street walls — the punched windows are designed to match the rhythm of their adjoining buildings — coming together and creating dramatic visual interest only at the point where they intersect. Below is a rolled out elevation from OMA. Note the gradient created by the windows as they converge toward the corner (center in the drawing below).

    The other interesting thing about this project is that it reminded me just how different the built form of Manhattan can be compared to Toronto. In the case of 121 East 22nd, the streetwalls rise 150 feet without any stepbacks. There is then a 10 foot stepback before the building rises another 60 feet — similarly without any additional breaks.

    I love the grandeur.

  • More on One Delisle and the block

    image

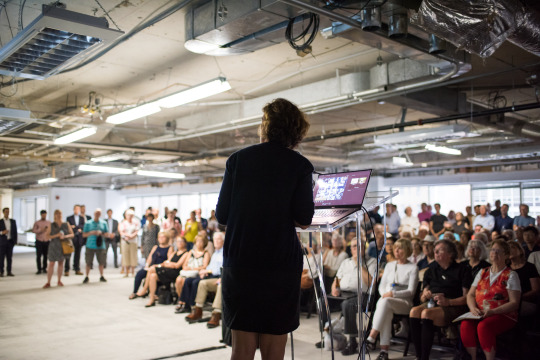
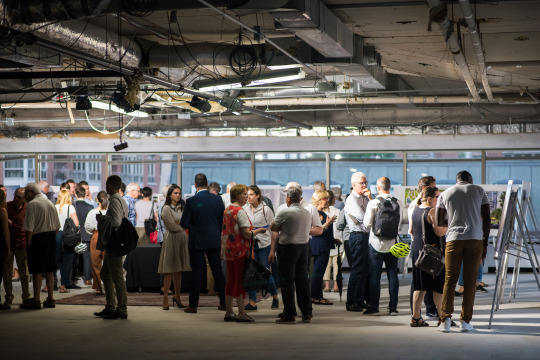
    Now that things have quieted down from last night, I would like to say that we are thrilled by the response to One Delisle and the broader ideas for the block. There was a lot of positivity last night at the open house and today the project team received countless emails and messages from people telling us that they are excited and/or looking forward to working with us over the coming years. Many were from the local community.

    image

    Following yesterday’s Globe and Mail piece by Alex Bozikovic, One Delisle was also covered in Urban Toronto (read the comments), designboom (they’re allergic to capital letters), ArchDaily, Canadian Architect, Dezeen, The Architect’s Newspaper, and probably other places that I am missing. The comments have been interesting to read and there seems to be a fatigue around boring glass boxes. This project team does not want to do that.

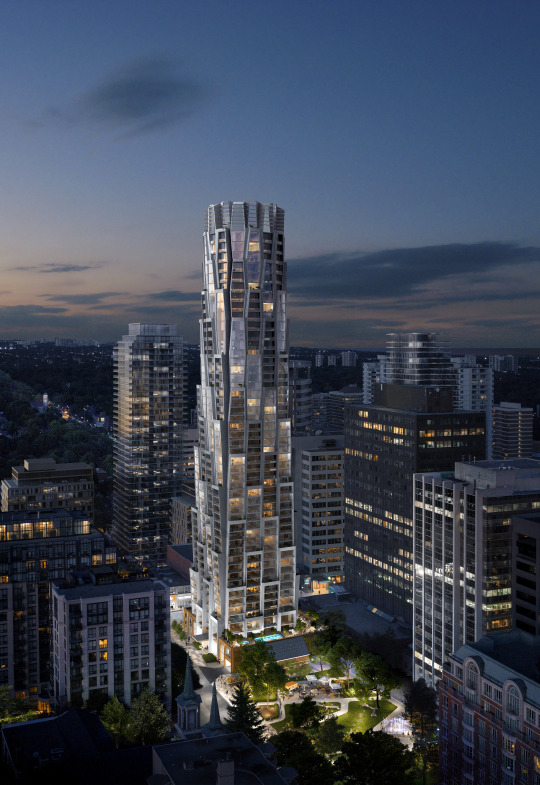
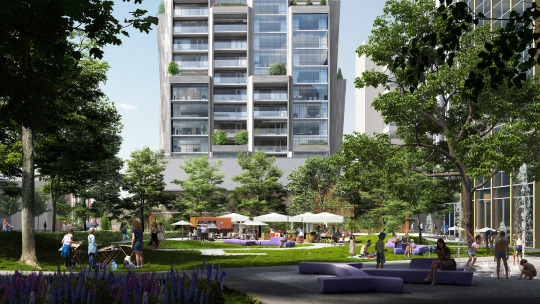
    Though the project has been making the rounds, there are two images that I don’t think have been widely shared and so I would like to do that today (below). Both were presented at last night’s open house. And they are intended to show the relationship between One Delisle and Delisle Park, which is proposed to be revitalized and expanded by ~50% as part of the project’s block and enhanced public realm strategy. Credit to ADHOC Studio for these renderings.

    imageimage

    In fact, it is important to keep in mind that while a lot of attention is being paid to the architecture of the building, there’s a broader city building strategy that is attached and integral to it:

    • Revitalize and expand Delisle Park by 50%
    • Add residential uses to a block of office buildings
    • Reduce the number of vehicular access points across the block from 5 to 3 in order to improve traffic flows in the area
    • Create below-grade vehicular connections across the block to consolidate and legitimize access/loading and once again improve traffic flows in the area 
    • Significantly widen the sidewalk along Yonge Street to eliminate existing pedestrian pinch point
    • Significantly widen the sidewalk along Delisle Avenue to strengthen connection to Delisle Park
    • Introduce pedestrian laneway with art canopy to connect St. Clair Avenue West back to Delisle Park
    • Create a unified and consistent public realm across the block and provide retail animation along its edges
    • Retain Art Deco facade along Yonge Street
    • Target the 2nd tier of the Toronto Green Standard (voluntary sustainability target)
    • Continue to explore the feasibility of district energy solutions across the block to take advantage of the different energy demand curves for office, retail, and residential uses

    Once again, a big thanks to the ~300 people who came out last night – in the rain – to engage with the project team. And a big thanks to the full project team who worked tirelessly to prepare for this week’s community open house. But as was said on Thursday night, in many ways this is really just the beginning. To stay informed about the project and to provide your feedback to the team, stay tuned to yongedelisle.ca.

    Photos: Khristel Studios

  • RioCan REIT announces new residential group

    On Monday, RioCan REIT announced its new residential brand: RioCan Living. This is the group that will now be responsible for redeveloping the 43 properties within their portfolio that they have identified as having intensification potential. Here’s how they are describing the new brand: “RioCan Living delivers best in class purpose-built rental units and condos along Canada’s most prominent public transit lines.”

    It has been interesting watching RioCan over the last 6 months. In the fall they announced that they would be selling off somewhere around $1.5 billion of their portfolio to rebalance toward Canada’s six largest markets, and in particular the Toronto market. And with this recent unveiling it is clear that they are doubling down on transit-oriented mixed-use communities as a way to future-proof their retail portfolio against disruption.

    Major markets. High-density. Transit-oriented. This shouldn’t surprise any of you. Here is a link to their latest investor presentation in case you’re curious.

  • Residential population densities compared

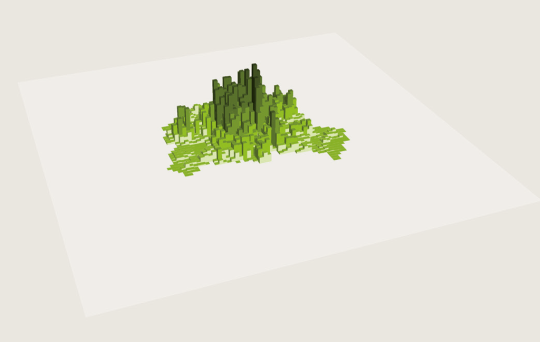
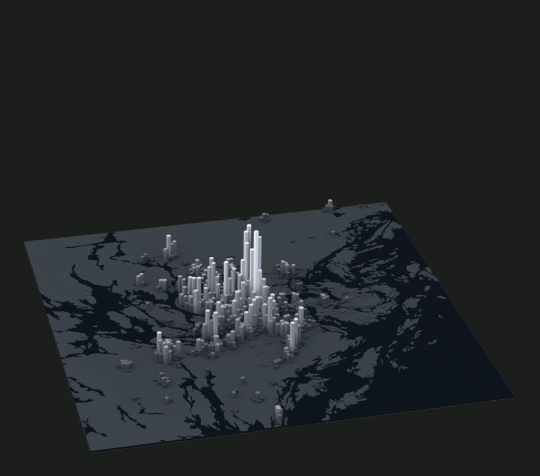
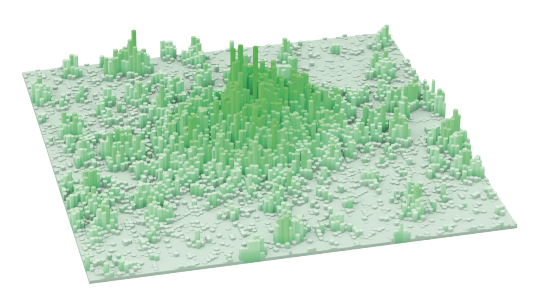
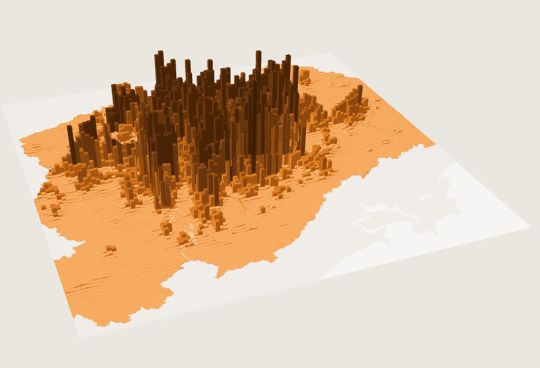
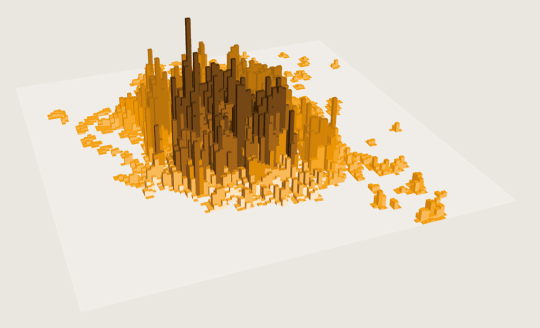
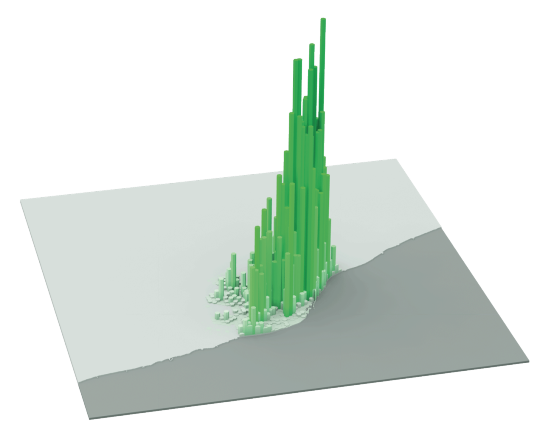
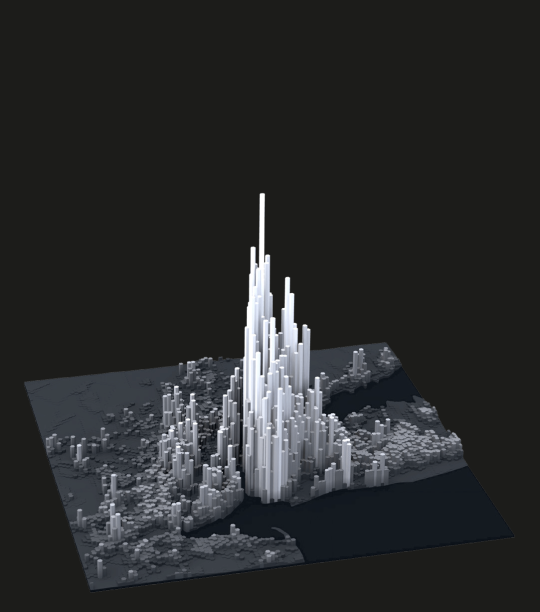
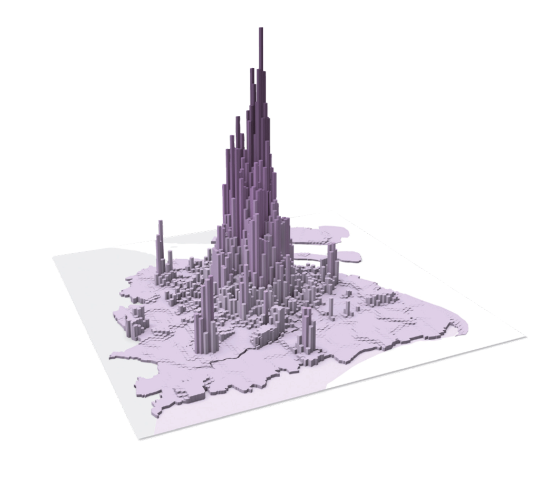
    The following diagrams were taken from LSE’s Urban Age website. I’ve sorted them from lowest to highest peak residential population density. In each case I’ve also included the year of the dataset. 

    It’s amazing how much these simple extrusion diagrams can tell you about the city. It also shows you that high population densities don’t necessarily need to equate to tall buildings. Barcelona, in particular, stands out for me.

    Berlin (Peak residential density: 21,700 people/km2, 2009)

    image

    Stockholm (Peak residential density: 24,900 people/km2, 2012)

    image

    London (Peak residential density: 27,100 people/km2, 2013)

    image

    São Paulo (Peak residential density: 29,380 people/km2, 2009)

    image

    Mexico City (Peak residential density: 48,300 people/km2, 2009)

    image

    Barcelona (Peak residential density: 56,800 people/km2, 2013)

    image

    New York (Peak residential density: 59,150 people/km2, 2012)

    image

    Shanghai (Peak residential density: 74,370 people/km2, 2011)

    image

    Istanbul (Peak residential density: 77,300 people/km2, 2013)

    image

    Hong Kong (Peak residential density: 111,100 people/km2, 2013)

    image

    Mumbai (Peak residential density: 121,300 people/km2, 2013)

    image