Daily insights for city builders, delivered every morning at 6 AM ET. I’m Brandon Donnelly — a Toronto-based real estate developer and founder of Globizen. I’ve been writing here since 2013.

Tag: research

  • How elevation impacts risk taking

    image

    There’s an old saying that we shape our buildings and environments and then they in turn shape us. 

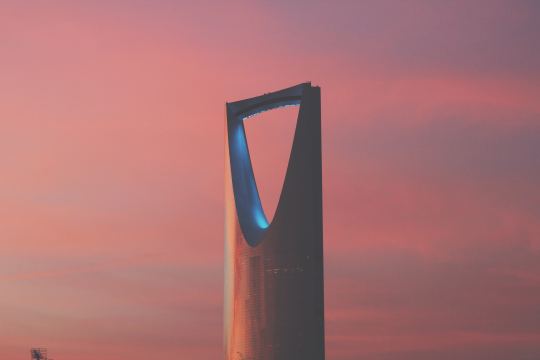
    Here is a fascinating research report about “the influence of physical elevation in buildings on risk preferences.” I discovered it through this MarketWatch article, which my friend John forwarded me this afternoon. 

    Here is a quote from the article:

    We then examined the correlation between hedge-fund volatility and office location in terms of number of stories above ground. We found that as the elevation of hedge-fund managers’ offices increased, they were more willing to take risks that resulted in more volatility. This was true even when statistically controlling for factors such as total assets, fund strategy and several other variables that could have led more resourceful hedge funds to occupy expensive offices that are often found on higher levels of buildings.

    Does this mean taller cities are also more volatile cities? Assuming this is all true, it once again proves that we are maybe not the rational decision makers that many us probably think we are.

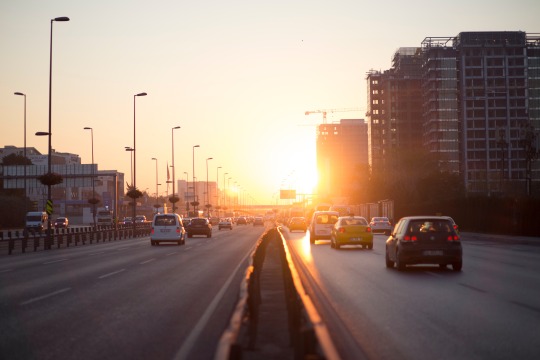
    Photo by Hala AlGhanim on Unsplash

  • What cars can tell you about a neighborhood

    This is an interesting study from a team of AI researchers at Stanford. What they did was use car images taken directly from Google Street View (so images of cars parked on-street) to predict income levels, racial makeup, educational attainment, and voting patterns at the zip code and precinct level.

    Admittedly, it’s not a perfect survey, but when they compared their findings to actual or previously collected data (such as from the American Community Survey), it turns out that their study was actually remarkably accurate. Google Street View allowed them to survey 22 million cars, or about 8% of all cars in the US.

    Here are some of the things they found:

    –  Toyota and Honda vehicles are strongly associated with Asian neighborhoods.

    – Buick, Oldsmobile, and Chrysler vehicles are strongly associated with black neighborhoods.

    – Pickup trucks, Volkswagens and Aston Martins are strongly associated with white neighborhoods.

    Interestingly enough, the ratio of pickup trucks to sedans, alone, is a pretty reliable indicator of voting patterns. If a neighborhood has more pickup trucks than sedans, there’s an 82% chance it voted Republican in the last election.

    Perhaps this isn’t all that surprising given that car purchases are highly symbolic. But given that the American Community Survey costs $250 million a year to administer, this study is a good preview of what cheaper and more realtime data collection might look like.

  • Escalator etiquette

    image

    I am one of those people that gets annoyed when people don’t follow proper escalator etiquette. The etiquette being: stand on the right; walk on the left. Some cities – London and Tokyo come to mind – are draconian about this.

    But it turns out that this is not always the best way to optimize throughput. A recent study conducted in London found that during peak periods – such as the morning rush hour – it is actually better for everyone to stand still.

    What they found was that when 40-60% of people chose to walk up on the left, maximum throughput was 115 passengers per minute. But when everyone stood still maximum throughput increased to 151 passengers per minute.

    The reason for this is that walking takes up more space than staying put on one step. When demand is low, this has no impact on capacity. But as soon as people start slowing down to avoid the set of legs in front of them, a bottleneck occurs and capacity starts to drop. 

    This is not dissimilar to what happens in traffic jams. Imagine if during peak periods all of the cars could separate themselves by only a few inches and travel at exactly the same (slow) speed. That’s not going to happen until self-driving cars hit the road, but it would be more efficient than the current chaos of distracted drivers starting and stopping.

    All of this being said, since this finding only applies during very busy times, I plan to continue being annoyed when proper escalator etiquette is not followed.

  • Driving in the HOT lane

    image

    Joe Cortright of City Observatory recently published an interesting post on HOT lanes (high-occupancy toll lanes) and cited a research paper by Austin Gross (University of Washington) and Daniel Brent (Louisiana State University). The paper looked at the behavioral response of drivers to dynamic HOT lane pricing. 

    They way HOT lanes work is simple: when traffic is light, the price dynamically decreases; when traffic is heavy, the price dynamically increases to ensure a minimum level of service. That is, the price increases until enough cars leave the lane and driving speeds increase to some minimum threshold. In this case, it’s 45 mph.

    The key takeaway from the report is that “value of reliability” appears significantly more important to drivers than “value of time”. Put differently: it’s less about the time I’m wasting in traffic and more about the uncertainty of not knowing when I’m going to arrive at my destination.

    It’s for this reason that HOT lanes are used more frequently in the morning (when you’re running late for that meeting) than in evening (when you’re just on your way home from work). 

    Gross and Brent estimate that the spread is about 7.5x. The typical driver values saving time at about $3 per hour and reliability improvements at about $23 per hour! This is fascinating because we tend to focus a lot on time. But arguably what people really want to buy is greater certainty.

    I can tell you that it’s definitely one of the things that I love about walking to work, or for that matter cycling somewhere. I always know how long it’s going to take.

  • Slot-based intersections

    If you don’t follow the work of MIT’s Senseable City Lab, I highly recommend that you start. 

    Earlier this year, researchers from the Massachusetts Institute of Technology, the Swiss Institute of Technology, and the Italian National Research Council developed something that they call “slot-based intersections.” In a world where cars have sensors and drive themselves, it is intended as a more efficient alternative to traditional intersections. Goodbye traffic lights.

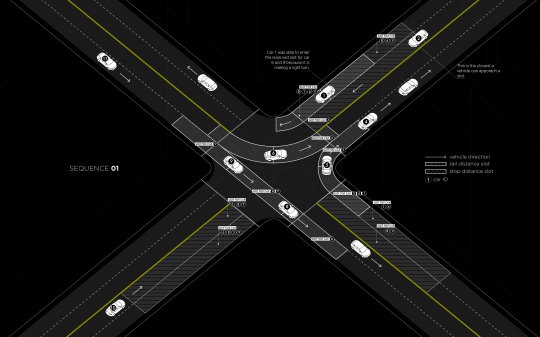
    Much like air-traffic control, the way the system works is by assigning individualized time slots to each car for when they may enter an intersection. For example, in the diagram below (Sequence 01) the car approaching from the bottom left (#10) has a “stop distance slot” in front of it reserved for 3 of the cars that are currently in the intersection. The two that are traveling perpendicular to it and the car currently turning left into the same lane as #10 (on the other side of the intersection). The car in the midst of turning right (#5) is exempt because there’s no possibility of collision. 

    image

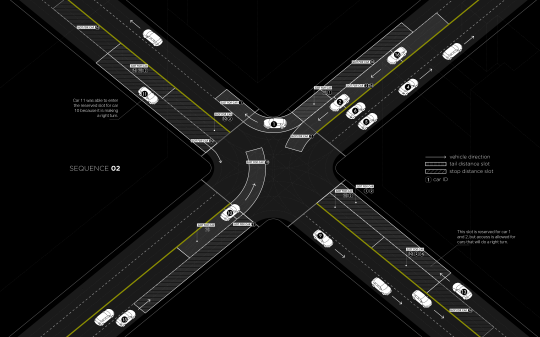
    In Sequence 02 (below) you can see that car #10 is now turning left, which means it has its own time slot in the intersection. Other approaching cars now have a “stop distance slot” dependent on car #10.

    image

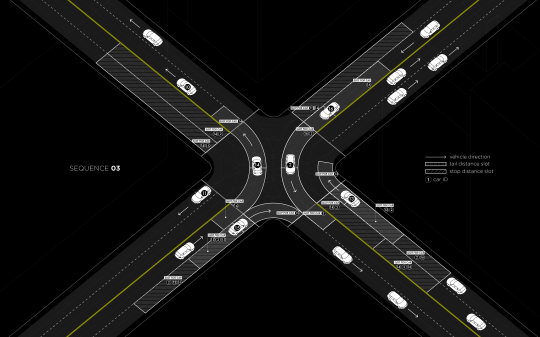
    In all cases, cars making a right turn are able to move freely, provided they will not interfere with any other cars.

    image

    The researchers estimate that real-time slot allocation might double the number of vehicles that a traditional traffic-light intersection can handle today and, in some cases, it might completely eliminate stop and go traffic.

    Often when I write about self-driving vehicles I hear people tell me that cars are still cars. It doesn’t matter whether they are self-driving or not. The same inefficiencies apply. They are not the solution to urban gridlock. Elon Musk was also criticized (following his Master Plan) for not properly understanding urban geography.

    But self-driving cars will create new efficiencies. I am not saying that they are a silver bullet, but I am saying that they will help a great deal. I don’t think that anyone truly understands the extent of these efficiencies, but there are a myriad of possibilities. This Senseable City Lab project is a perfect example.

    What I am grappling with right now is the relationship between self-driving vehicles and traditional forms of public transit. Until we get a handle on the efficiencies and overall impact, it’s hard to ascertain how these different forms of mobility will work together. My gut tells me that the lines are bound to get blurry and that self-driving “cars” will feel less and less like the cars we know today.

    Below is a video that was published along with the research. If you can’t see it, click here.

    [youtube https://www.youtube.com/watch?v=4CZc3erc_l4?rel=0&w=560&h=315]

  • If man had developed a third arm, where might this arm be best attached?

    Roman Mars of 99% Invisible recently published an excellent episode called The Mind of an Architect. It has to do with a set of research studies completed in the late 1950s by an organization at the University of California, Berkeley known as the Institute of Personality Assessment and Research (IPAR).

    IPAR was founded by a personality psychologist named Donald MacKinnon. He initially worked for the precursor to the CIA and founded IPAR with the intent of studying “combat readiness and efficiency.” But over fears of how creative the Soviets were getting, the focus of IPAR shifted to instead studying creativity.

    And architects were deemed to be an ideal test subject (from 99percentinvisible.org):

    “Researchers saw architects as people working at a crossroads of creative disciplines, a combination of analytic and artistic creativity. As professionals, architects had to be savvy as engineers and businessmen; as aesthetes, they also acted as designers and artists.”

    So over a series of weekends in the late 1950s, some of the most celebrated minds in architecture – including people like Philip Johnson, Richard Neutra, and Louis Kahn – were studied and picked apart. 
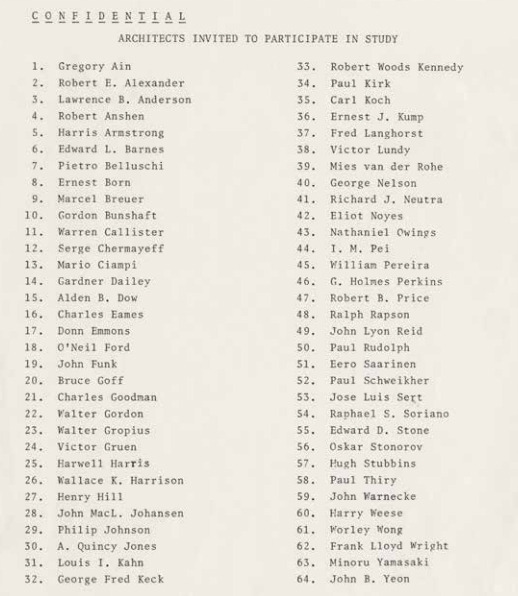
    image

    They were asked to do quick sketches, create mosaics, and they were asked questions such as this one: “For the next 45 minutes we would like you to discuss this notion: if man had developed a third arm, where might this arm be best attached?”

    In the end, here’s what they concluded:

    The researchers began to notice certain patterns across creatives of all professions and genders, including a tendency to nonconformity and high personal aspirations. They also found many creatives shared a preference for complexity and ambiguity over simplicity and order. Creatives could make unexpected connections and see patterns in daily life, even those lacking high intelligence or good grades.

    In short: IPAR found that creative people tend to be nonconforming, interesting, interested, independent, courageous and self-centered, at least in general. Many of these traits may seem obvious today, but they were not necessarily obvious prior to these studies. Back when their tests were being conducted and findings presented in the 1950s and ’60s, the very idea of a “creative personality” was a novelty in academic and public discourse.

    The findings may not be groundbreaking to us today, but the documents and recordings produced during the study are certainly interesting. If you’re into this topic, there’s also this book you can pick up.

    Oh, and if we are to have a third arm, I would like mine to run almost parallel to my existing dominant arm (right). That way I could double up on my most potent dexterity. It would also be far less intrusive than an arm on one’s head or in the middle of one’s back. Then again, it would ruin our symmetry as humans. And perhaps that third arms need to be celebrated instead of being masked.

    What would you suggest?

    Image: Institute of Personality and Social Research, University of California, Berkeley / The Monacelli Press (via 99% Invisible)

  • The urban wealth pendulum

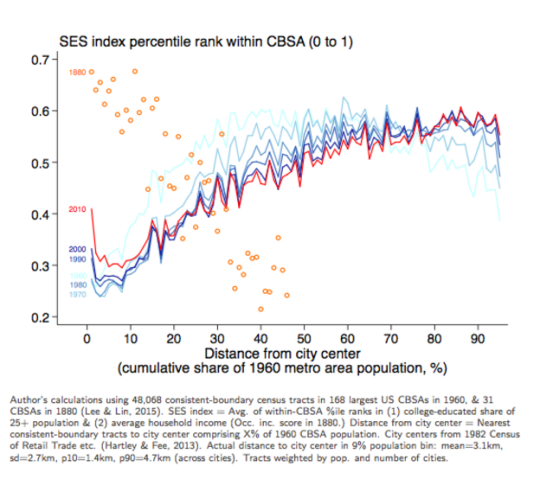
    Jeffrey Lin, who is an economist at the Federal Reserve Bank of Philadelphia, recently published the following chart:

    image

    I found it in this Washington Post article. And it’s packed full of fascinating information.

    The chart compares the socioeconomic status in US cities (y-axis) against “distance from city center” (x-axis) in 1880 and then in recent years (1960 to 2010 census data). The orange circles represent the 1880 data and the red and blue lines represent the recent census data.

    What this chart and research tells us is that in 1880, rich people overwhelmingly lived in the center of cities. And as you moved further away from the city center, socioeconomic status fell off pretty precipitously. This makes sense given that, at the time, it was hard to get around and travel long distances.

    However, in the post-war years, the exact opposite became true. We began driving and wealth decentralized. This should surprise no one. 

    But what’s interesting is how this appears to be reversing. In 2010 (the red line), there’s a sharp increase in socioeconomic status for people living basically right in the center of cities. And for the 30 – 60 km range, there has been a decrease in socioeconomic status essentially from the 1960s onwards. 

    The important takeaway here – which is spelled out in the Washington Post article – is that the neighborhoods which appear to be in high demand today are also in very short supply:

    “We have 80 years of essentially zero production of neighborhoods with these qualities,” Grant says. “We’ve spent the last 80 years building car-oriented suburbs. Then when the elites decide they want to go back into the city, there’s not enough city to go around.”

    This is one reason why supply matters.

  • Prime property appreciation around the world

    Every year for the last decade, Knight Frank has published something called The Wealth Report. I’ve written about it before, but it’s basically a look at “prime property” and global wealth.

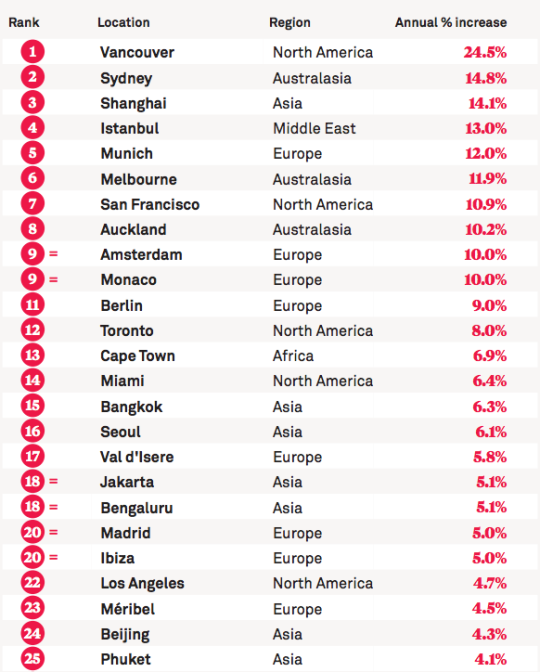
    As part of the report, they have something called the PIRI 100. It’s their “Prime International Residential Index”, which looks at luxury residential property prices around the world. They generally define “prime property” as being the top 5% of each market according to value.

    This year, the top 25 locations in their PIRI 100 are as follows (for the most part, the data is up to December 2015):

    image

    Here in Canada, we like to talk about the insanity of the Vancouver and Toronto real estate markets. This list helps to put that into perspective. Even by global standards, Vancouver is at the top of the pack by quite a significant margin. 

    It’s worth noting that since this is a “prime property” index, it’s pretty safe to assume that the buyer profiles for these sorts of properties would have a significant international bias. So in a way, this list is really about global capital flows.

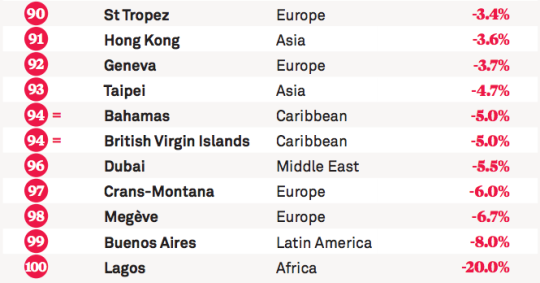
    Here are the bottom 10 locations on this year’s list:

    image

    If you’d like to see the full list, click here.

  • The impact of Chinese buyers on Vancouver’s single family home market

    I have a new favorite blog that I think you might all enjoy as well. It’s called BT | A | Works and it is the “architectural and urban research and development division” of Bing Thom Architects in Vancouver. 

    I think it’s it’s important to have people in a firm who are researching and experimenting with ideas beyond the day-to-day tasks of a job. So I was excited to discover their work this morning.

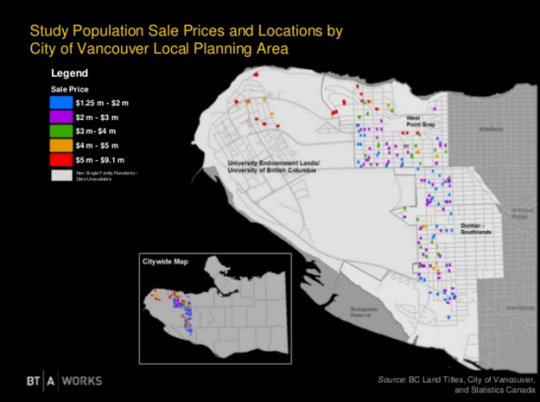
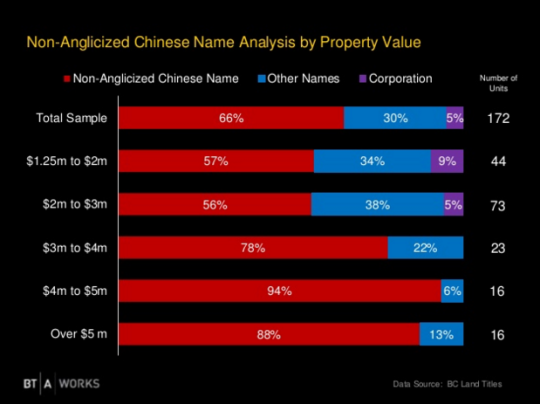
    Their most recent post is a look at ownership patterns of single family homes sold in 3 west end neighborhoods in Vancouver from September 2014 to February 2015 (a 6 month period). These are some of the most expensive areas in the city and, collectively, they found 172 properties sold with an aggregate value of around $520 million.

    Given the presence of foreign buyers in Vancouver’s real estate market, one of the things they then did was identify “non-anglicized Chinese names” on the title records. This means names like “Li Xian”, but not names like “Andrew Shui-Him Yan”, because the anglicized first name suggests that they are probably not a new immigrant or probably not living abroad.

    Here’s what they found:

    In total, 66% of the properties in the sample (172 properties) were associated with a non-anglicized Chinese name. And for properties over $5 million, the percentage jumps to 88%. The other interesting thing worth noting is that 23% of the registered owners declared their occupation as “homemaker/housewife.”

    I thought this would serve as an interesting follow-up to the post I wrote about a month ago called, Is Hongcouver better off than Vancouver? If you’d like to see the full BT | A | Works presentation, click here.

  • How open are you to experiences?

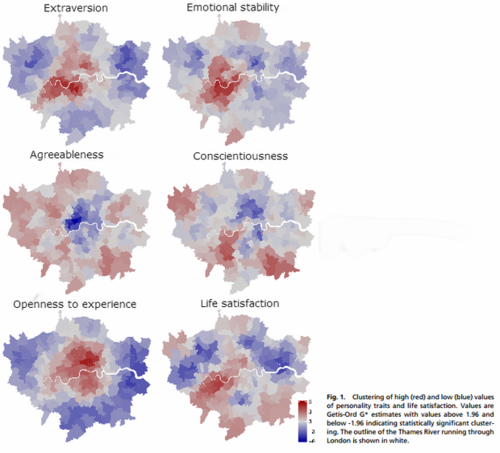
    This morning Richard Florida published an interesting CityLab article that talks about how different personality types cluster within cities. The study he references was done by a team of psychologists that surveyed 56,000 people in the London metro area.

    Here is a summary of what they found (darker red indicates higher concentration of each personality trait):

    image

    Probably the most interesting personality trait is the “openness to experience” one, as there appears to be a clear divide between people who live in the center of London and people who live in the suburbs.

    Here’s how Florida describes it:

    The most clustered personality trait the researchers found was “openness to experience” (bottom left map), which is concentrated in the center of London. Openness to experience, according to a wide body of psychological studies, is associated with creativity, innovation and entrepreneurship. This type is concentrated in higher density neighborhoods, with higher housing prices, more ethnic and religious diversity and higher crime ratesMeanwhile, the blue concentrations at the periphery indicate that there are fewer people open to experience in metro London’s suburbs.

    It’s fascinating to think about the role of psychology in city building. It’s not something we often talk about, but it’s there.

    I live downtown and I would definitely classify myself as extraverted and open to experiences. How would you classify yourself?

    Maps via CityLab