Daily insights for city builders, delivered every morning at 6 AM ET. I’m Brandon Donnelly — a Toronto-based real estate developer and founder of Globizen. I’ve been writing here since 2013.

Tag: redfin

  • Opendoor wants to be a transaction layer for homes

    We have spoken a lot over the years about Opendoor. And for a period of time, iBuying seemed like a very good idea. Zillow go into it. Redfin got into it. Everybody was iBuying. But then this year everybody started losing money, mostly due to algorithms that could not contend with falling prices.

    It turns out that being a market maker for homes can be a tough business because there is a lag between when you buy the home and when you hope to sell it. And so right now, few people want to be an iBuyer. Zillow no longer does it. Redfin no longer does it. And Opendoor’s stock is, at the time of writing this post, down 87.19% YTD.

    It is pretty easy to be pessimistic on this space, and that pessimism may be warranted. Though it may not be. My thinking has always been as follows. The process of buying and selling a home will eventually move online. The industry is ripe for change and there is no debating that. The real question is: how the hell do you do it? Everybody, including me in my late 20s, has tried.

    Two-sided marketplaces are tricky, because you always run into a chicken-and-egg problem. If you don’t have buyers, no seller is going to bother with your real estate marketplace. And if you don’t have sellers (i.e. homes), no buyer is going to bother with your real estate marketplace. So generally speaking, the way to build a marketplace is to start with one side, somehow get them on and using the platform, and then open it up to the other side.

    And this is exactly what iBuying hopes to do. Today it is largely a tool for sellers. It is a tool that says, “I will give you instant liquidity for your home so you don’t have to worry or care about who might actually buy it.” This is, of course, convenient for sellers, which is why people have been using it; but it is capital intensive and, as we have seen this year, it transfers some risk to the iBuyer.

    In the world of Opendoor, they call this a first-party (1P) transaction. It is them buying directly from sellers. But the larger vision is for Opendoor to become more of a transaction layer and instead just facilitate third-party (3P) transactions. This is currently being done through Opendoor Exclusives and the objective here is to match buyers and sellers directly, so that Opendoor can avoid taking on the risk of actually owning homes for a period of time.

    Will this work? I don’t really know. But I do think it is exciting and I do think it is the way to think about what Opendoor is ultimately trying to do with their business.

    Reminder: I am long $OPEN

  • Redfin experiment shows how home buyers react to flood-risk data

    This is a fascinating little experiment:

    From Oct. 12, 2020 to Jan. 3, 2021, Redfin ran an experiment on 17.5 million of its users across the US. As prospective homebuyers entered the site, Redfin assigned them randomly to either a group that was shown flood-risk information on each property or a group that was not.

    The flood-risk scores came from First Street Foundation, a climate and technology nonprofit that works to make climate hazards more transparent to the public. In June 2020, First Street published the first public maps that revealed flood risk for every home and property in the contiguous US. 

    First Street scores properties on a scale of 1 to 10 based on the likelihood that they will flood in the next 30 years (which is assumed to be a typical mortgage term). A score of 1 means the property has “minimal” risk and a score between 9-10 is considered “extreme” risk.

    So what happens once you start showing people flood-risk information? They, not surprisingly, start systematically looking for safer properties. After one week of users being exposed to this new information, prospective buyers who were previously looking at “extreme” homes started looking at homes that were about 7% safer.

    After 9 weeks, these same “extreme” home buyers were looking at properties that were about 25% less risky. And for some buyers, in particular those working with a Redfin agent or partner, their flood-risk tolerance dropped by over 50%. (Embedded in this data might be a sales pitch for working with a knowledgeable Redfin agent or partner).

    Also interesting is the fact that below “severe” flood risk (a score between 7-8), there was very little change in behavior. “Major” flood risk, it would seem, isn’t all that concerning to most buyers. It needs to be “severe”. Nevertheless, it is noteworthy that people will in fact make behavioral changes when presented with clear climate-risk data.

  • A few charts on the US housing market

    Here a three interesting charts about the US housing market from Redfin (via Charlie Bilello’s weekly newsletter).

    Bidding wars, which are defined as an offer with at least one other competing bid, declined from nearly 70% of sales at the beginning of this year to about 44% as of July 2022.

    Stale inventory, which is defined as a home sitting on the market for more than 30 days, is up 12.5% year-over-year. This is the highest jump since 2012, not counting the spike at the beginning of the pandemic (April 2020).

    The number of US homes that cut their asking price over the last 4 weeks is now up to 7.8% as of the first week of August 2022. This is the highest percentage since 2015. The seasonality exhibited in this chart is also interesting.

    All of this said, the median sale price for a home in the US is still up 8.2% on a year-over-year basis. Though since June of this year, prices have fallen about 4.1%. I don’t know about all of you, but I’d much rather be buying today than in January of this year.

  • What is the premium for a home in a walkable community?

    According to this RedFin data from 2019 — which looked at normalized sale prices and Walk Scores above 50 — it is about 23.5% or $77,668 for 16 major US metro areas. Again, this is 2019 data and so things may have changed a bit, especially with the whole COVID thing.

    It also varies by metro area in this data set. The premium in Boston, for example, is almost 30%. Whereas the premium in Oakland is actually a slight discount (-1.3%). There are going to be local conditions that play a role.

    But as a whole there is an economic trend here that makes intuitive sense to me. Though it’s not just a question of how pricey your home is. You also need to consider your transportation costs, the value of your time, and the health benefits of living in an environment that promotes consistent and moderate activity.

    When you factor all of these things, maybe “premium” isn’t the right way to look at this.

  • Second home and investor mortgage applications accounted for 14.1% of all applications in February

    As a follow-up to my recent post about the rise of the second home, here is a chart (via the WSJ) showing second home and investor mortgage applications as a share of all applications in the US. In February of this year (2021), second home and investment properties accounted for 14.1% of all applications. This is a record number going back to January 2010.

    What’s also interesting about this chart is that, but for COVID, it shows a general decline over the last decade. I’m not sure what the split is between vacation and investment properties, but can we conclude that pre-COVID Americans were becoming less interested or perhaps less able to own a second home? And could the reason be that instead of owning a second home, more people simply started relocating permanently?

    There is also an obvious seasonality to these applications. Each of the above valleys tend to correspond to the spring and summer months. It’s almost as if every fall/winter we start thinking to ourselves, “Right, winter. Let’s look for a place somewhere else.” Is it that, or are there other forces at work here?

  • The rise of the second home

    Real estate brokerage firm Redfin recently did an analysis of “mortgage-rate lock data” taken from the analytics firm Optimal Blue. A mortgage-rate lock is an agreement between a lender and a borrower guaranteeing a particular interest rate for a particular period of time.

    What’s potentially interesting about this data is that (1) approximately 80% of mortgage-rate locks apparently result in an actual home purchase and (2) buyers must specify whether they’re applying to secure a rate for a primary home, a second home, or an investment property. So there’s a high degree of intent that goes along with these applications.

    What Redfin found when they looked at the data is that the growth in demand for second homes is exceeding that of primary homes by quite a wide margin. They argue that this is largely a result of people now working remotely.

    But this rise in demand — at least according to the above data — appears to have started in the second half of 2019. So I think a few more data points would be helpful in understanding what’s really going on. Is what we’re seeing more about acceleration than about causation? And what does this look like a year from now?

    Chart: Redfin

  • Knock knock — more on Opendoor

    Packy McCormick’s latest “Not Boring” essay is up and it’s about Opendoor. It’s a good follow up to last week’s announcement.

    Maybe that’s why housing is one of the last major categories that technology has left alone. Sure, companies have tried. Tons of them. The startup graveyard is filled with companies led by entrepreneurs who realized that the way we buy and sell homes sucks, but couldn’t ultimately figure out how to change it. They weren’t thinking big or long-term enough. The companies that have made the biggest impact, like Zillow and Redfin, make it easier to search for houses, but then kick buyers over to agents to go through the offline process, the same way it’s always been done. 

    This is topic/problem that is near and dear to me because I spent a year of my life working on a startup that initially set out to solve this exact problem. But like countless others, we couldn’t figure out how exactly to change things. So we pivoted.

    Has Opendoor finally cracked the code? I don’t know. But they’re on to something. It is, however, worth noting that the company was founded in 2013. And so what is happening today is already 7 years in the making — and probably longer if you consider the founder’s past startups.

    Tough problems clearly require time. Money doesn’t hurt either.

  • Algorithmic home buying expands to Los Angeles

    Algorithmic home buying companies (or iBuyers) have now started to expand into Los Angeles. If you recall, most of these companies started in smaller markets where the homes are more homogenous, relatively inexpensive, and generally less liquid. Places like Phoenix.

    By tackling the second largest housing market in the US (after New York City), the algorithms of Opendoor, Redfin, and Zillow will now need to content with an older housing stock, greater variability, and higher values.

    All of these companies have increased their maximum offer price. The sweet spot for algorithmic home buying has typically been in the $150,000 to $300,000 range. Last year, two-thirds of all homes bought by iBuyers were in this range. I can’t imagine that gets you very much in LA.

    I keep expecting these companies to scale into something more beyond just iBuying and flipping. Perhaps we will see that happen once they establish themselves in country’s biggest markets.

    Photo by Josh Rose on Unsplash

  • Redfin is rolling out an online purchase option for homes

    There’s a lot of money at work right now trying to reinvent the way that homes are bought and sold. Perhaps the most popular trend is “instant buying” or algorithmic home buying. I have been writing about this for years, mostly because of Opendoor. But now there are lots of companies competing in this space. With this model, home sellers get the benefit of an almost immediate sale, though usually it’s at a slightly lower price.

    Redfin, on the other hand, is returning to something that it first tried out back in 2006: a buy now button on its online listings. It failed back then. But maybe it was simply too early. The feature allows unrepresented buyers — that is, buyers without an agent — to make online offers. Naturally, it’s far from a single click process. But when accepted, the seller ends up paying about half the amount of commission.

    According to the New York Times, the company started testing the feature in late March in the Boston area. Of the 120 homes listed on Redfin with a “start an offer” button, 5 ended up being purchased via an online bid. That’s more than I would have expected. But Redfin positions these offers as being the stronger option because they save sellers money. There’s also an option to tour the home on your own.

    Given this initial response, the company is now working to roll out this feature nationally, market by market. Is this the future of home buying?

  • Biggest US real estate website to acquire 2nd biggest US real estate website

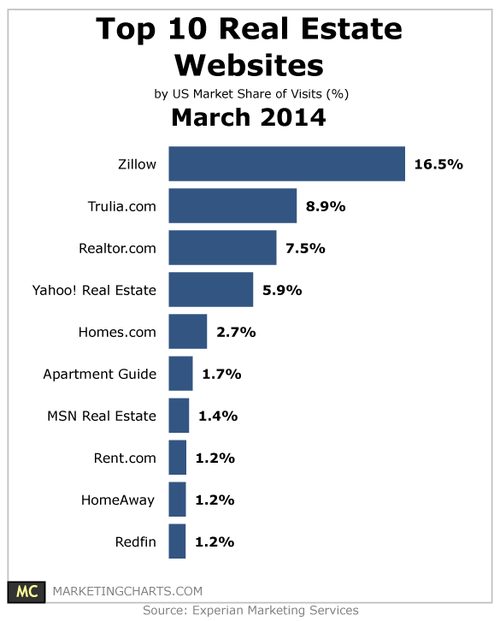
    Today it was announced that Zillow.com will be buying Trulia.com for $3.5 billion in a stock-for-stock transaction. Based on share of web visits, the biggest real estate website in the US has just acquired the 2nd biggest.

    image

    Both companies make the bulk of their money through advertising sales to real estate professionals (i.e. agents and brokers). But what was interesting to read in their press release is that, even with this merger, the combined revenue of both Zillow and Trulia still only represents about 4% of the estimated $12 billion that US real estate professionals spend on marketing each year. 

    Zillow says it’s because the real estate industry hasn’t fully made the switch to online and mobile – and thus it represents a huge market opportunity for them. And from my experience I would say that this is likely the case. But it could also be because the real estate community is putting their marketing dollars elsewhere online. 

    Whatever the case may be, Zillow.com (and its portfolio of companies) is now firmly positioned as the largest real estate website in the US. But even still, Zillow.com has never felt fully “net native” to me. It has never felt as if it were specifically built for the internet and that it’s only possible because of the internet. Instead, it feels like an offline model ported over to online. And the two are quite different.

    The reason I feel this way is because there’s an inherent tension to the way the online residential real estate market works today. Virtually every lead generation tool (that agents use) is intended to funnel buyers and sellers to them. That’s why so many real estate websites have sucked for so long. Because the goal wasn’t to keep you locked into a website, it was to get you to connect, in person, with an agent.

    Zillow and Trulia started to break with that tradition by offering a lot more information online. Before they came along, it was a lot harder for real estate consumers to do their own research. But at the end of the day, Zillow makes money when it’s an effective sales funnel for agents. And since that’s always been the way the market has worked, it doesn’t feel net native to me.

    If my gut is right, then it means there’s still lots of opportunities in this space.