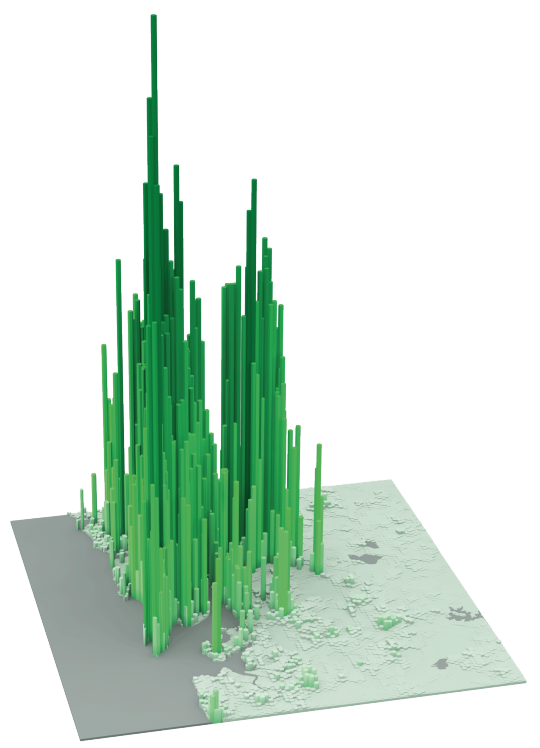
The following diagrams were taken from LSE’s Urban Age website. I’ve sorted them from lowest to highest peak residential population density. In each case I’ve also included the year of the dataset.
It’s amazing how much these simple extrusion diagrams can tell you about the city. It also shows you that high population densities don’t necessarily need to equate to tall buildings. Barcelona, in particular, stands out for me.
Berlin (Peak residential density: 21,700 people/km2, 2009)
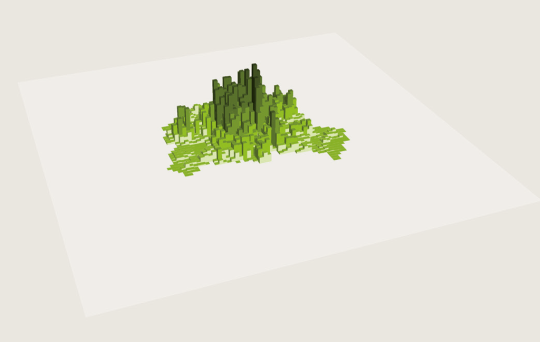
Stockholm (Peak residential density: 24,900 people/km2, 2012)
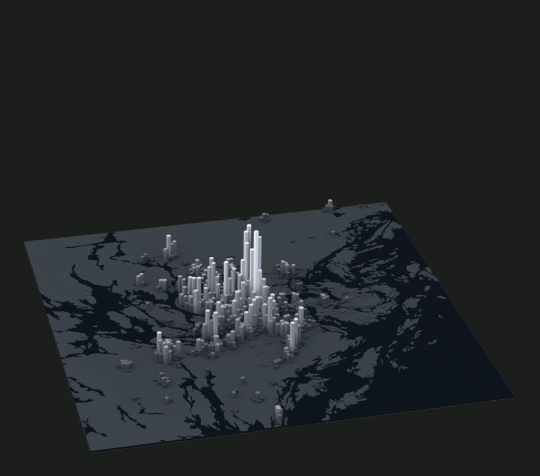
London (Peak residential density: 27,100 people/km2, 2013)
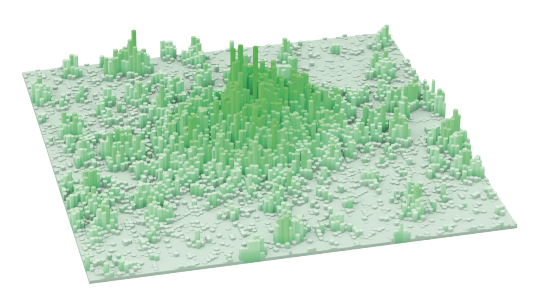
São Paulo (Peak residential density: 29,380 people/km2, 2009)
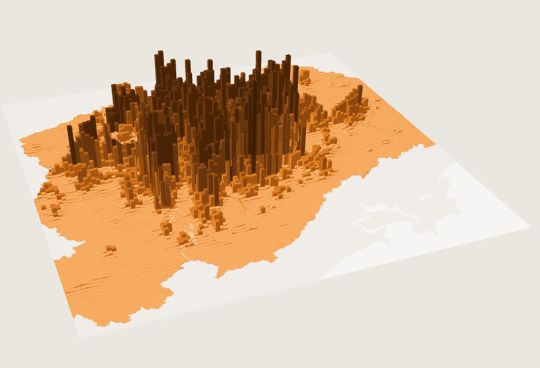
Mexico City (Peak residential density: 48,300 people/km2, 2009)
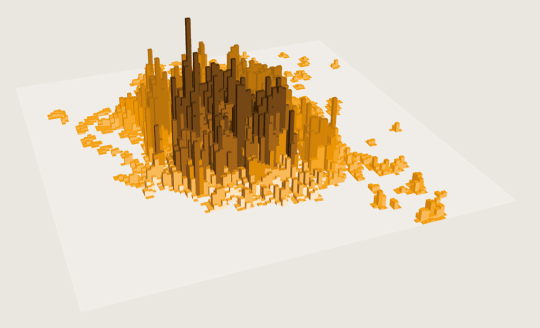
Barcelona (Peak residential density: 56,800 people/km2, 2013)
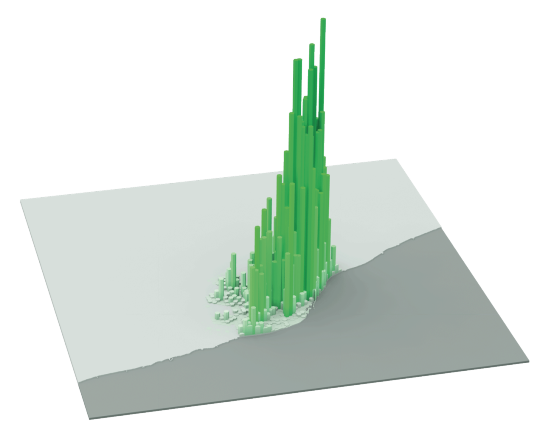
New York (Peak residential density: 59,150 people/km2, 2012)
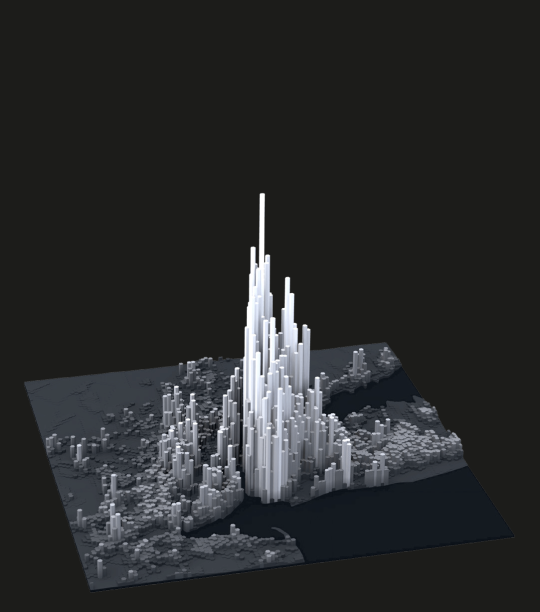
Shanghai (Peak residential density: 74,370 people/km2, 2011)
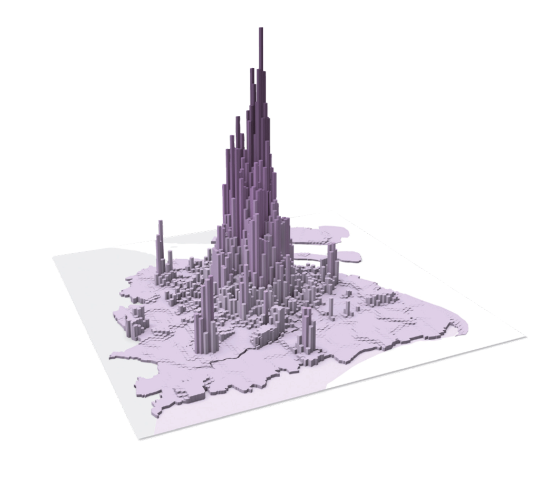
Istanbul (Peak residential density: 77,300 people/km2, 2013)
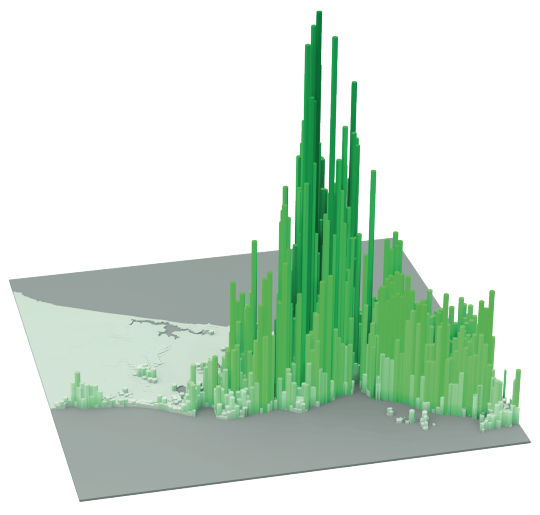
Hong Kong (Peak residential density: 111,100 people/km2, 2013)
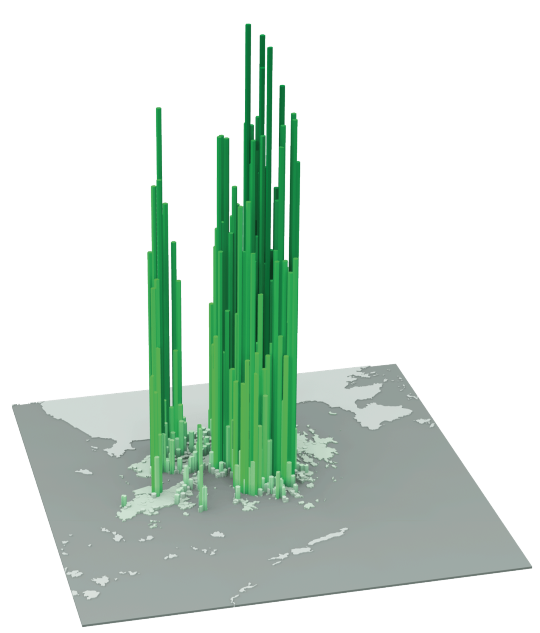
Mumbai (Peak residential density: 121,300 people/km2, 2013)