Daily insights for city builders, delivered every morning at 6 AM ET. I’m Brandon Donnelly — a Toronto-based real estate developer and founder of Globizen. I’ve been writing here since 2013.

Tag: orlando

  • The US is building a lot of apartments right now

    As of November 2023, it was estimated that there were 988,000 homes under construction in multi-family buildings containing 5 or more units. This is in comparison to 680,000 single-family homes, according to US Census data. (Looking at the below graph, it’s also interesting to see how the supply of single-family homes dropped off after the global financial crisis and multi-family apartments took off.)

    All of this means that in 2024, the US is on track to complete more apartments than it has in many many decades. In fact, exactly similar to what we experienced here in Toronto, if you want to find a comparable multi-family supply number, you need to go as far back as the 1970s (see below). Of course, the US had fewer people back then, and so on a per capita basis, it was building more housing.

    Still, all of this new supply is having an impact. Apartment List recently published its national rent report, over here. And overall, it found that:

    Rent increases are currently being moderated by a robust construction pipeline expected to deliver a decades-high number of new apartment units in 2024.

    More specifically, they found that the cities with the most supply are now seeing the largest rent declines:

    Many of the steepest year-over-year declines remain concentrated in Sun Belt cities that are rapidly expanding their multifamily inventory, such as Austin (-7.4 percent year-over-year), Raleigh (-4.4 percent), and Orlando (-3.9 percent).

    If you’re an apartment developer, this is not what you want to see. It means that increased competition is creating downward pressure on rents and that vacancy rates are probably rising. But if you’re someone looking to rent an apartment, this is exactly what you want to see. You want more affordable housing. And so, as a consequence, you want more homes to be built. Because when supply outstrips demand, this is what you get.

    Charts: Apartment List

  • Bad and good street networks

    Let’s add some historical context to yesterday’s post about autonomous vehicles. As the regular non-autonomous version of cars started to infiltrate our cities in the early 20th century, largely following the creation of the mass-produced Ford Model T, there was a general view that cars were dangerous and a menace to cities. Arguably, not much has changed.

    So in the 1930s, the Federal Housing Authority decided to publish a pamphlet explaining what street networks it thought were suitable for this new emerging car world and which street networks were not. The exact terms that they used were “bad” and “good”, and here’s what that looked like (taken from this CNU article):

    The “bad” ones are largely how the US liked to design its cities before the arrival of the car. Some historic settlements, like Boston and Manhattan south of 14th street were based on different street logics, but as far back as the 1680s, William Penn had already started laying out a grid iron plan for Philadelphia. And in reality, this kind of street pattern goes all the way back to ancient cities.

    However, when the car arrived, these grid iron plans were thought to offer an inadequate amount of separation between people and machine. The solution was to optimize around the car and introduce a clear hierarchy of different streets. Big streets for moving cars quickly, and smaller streets, like cul-de-sacs, for people to live on.

    These “good” examples, of course, represent the modern suburb. But we now recognize that these types of street networks are unequivocally terrible for walkability, the environment, public health, social equity, and a whole host of other things. I mean, look at this extreme example of two suburban homes in Orlando whose backyards adjoin but are technically separated by 7 miles and a 20-minute drive!

    My point with all of this is that, for many/most at the time, this was progress. Cars were the future and there was optimism about the kind of freedoms and other benefits that they would bring to people. And this optimism is perhaps not all that different from what many people feel today, myself included, when it comes to autonomous vehicles.

    So on the one hand, you could point to the car and say, “look at all the damage that this thing did to our cities. Let’s not do that again. Autonomous vehicles must be stopped.” But that’s akin to wishing the car was never invented. Another option is to point to the negative externalities associated with the car and say, “look at what we’ve done. We can do better. Let’s make our cities better.”

    Positive change, no matter how late, is always a possibility.

  • Job mixes and job losses

    Recent job posting data from Indeed has revealed a bit of a paradox. The metro areas where more people are able to work from home — i.e. tech hubs and finance centers — have experienced larger job posting declines compared to all other US metros, as well as to tourism destinations such as Las Vegas and Orlando.

    We know that the hospitality and tourism sector has been the hardest hit by the current environment. But that doesn’t appear to be the biggest driver for overall job losses. In fact, one of the key takeaways is that job losses between February and June 2020 look to be correlated with metro size. That is, the bigger the city, the greater the job losses (% change).

    So what’s going on?

    Well, according to Indeed, it’s important to look at the local job mix. In “work-from-home metros” like Seattle, San Francisco, and Boston, there has been a relatively high percentage of people who were able to quickly transition to working from home. This is reflected in the anonymized mobile-device data for these cities. More people at home. Less mobility. And a seemingly stronger adherence to social-distancing protocols.

    The problem with this outcome is that it crushes most of the in-person sectors and businesses that relied on this workforce moving about the city — things like food prep and beauty & wellness. I mean, just think about all of the food businesses that survive off lunches in a CBD. According to Indeed, it is these sorts of local economic connections that have really been driving the declines in job postings and overall payroll employment during lockdown.

  • The most segregated cities in North America

    The Martin Prosperity Institute here in Toronto just released a new research study called Segregated City: The Geography of Economic Segregation in America’s Metros

    The report looks at the physical sorting and separation of advantaged and disadvantaged groups within cities. And it did so across 70,000+ Census tracts in the US and in terms of 3 different dimensions: income, education, and occupation.

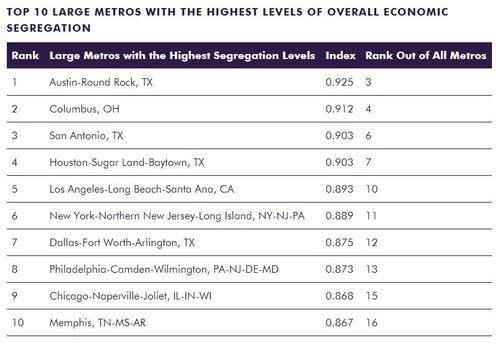
    Here are the most segregated “large metros” in the US:

    image

    Table Source: MPI

    And here are some of their broader findings – taken verbatim from page 9 of the study (click here for the full report):

    Economic segregation is positively associated with population size and density. It is also positively correlated to two other sets of factors that follow from metro size and density: how people commute to work and the breakdown of liberal versus conservative voters.

    Economic segregation tends to be more intensive in high-tech, knowledge-based metros. It is positively correlated with high-tech industry, the creative class share of the workforce, and the share of college grads. In addition, it is associated with two key indicators of diversity, the share of the population that is gay or foreign-born, which tend to coincide with larger, denser and more knowledge-based metros.

    Economic segregation is connected to the overall affluence of metros, with positive correlations to average metro wages, income, and economic output per capita.

    Race factors in as well. Economic segregation is positively associated with the share of population that is black, Latino, or Asian, and negatively associated with the share that is white.

    Economic segregation is associated with income inequality and even more so than with wage inequality. Its effects appear to compound those of economic inequality and may well be more socially and economically deleterious than inequality alone.

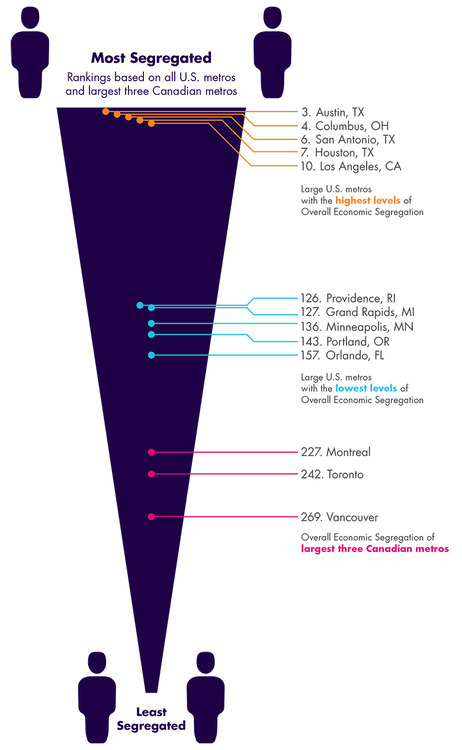
    The research team also looked at how Canada’s 3 largest metros – Toronto, Montreal, and Vancouver – compare to those in the US in terms of segregation. 

    The finding was that Canadian cities are overall less segregated than US cities, but that it should still be considered an area of concern. The most segregated of Canada’s 3 largest metros was found to be Montreal.

    image

    Image Source: MPI

    My view is that our economy is going through a profound shift right now. We’re transitioning from the industrial age to the information age. And in its wake, we’re seeing a number of disruptions, one of which appears to be rising inequality and segregation. 

    That’s not to say that I think this transition is a bad thing (I don’t think it is), but I do think we should be carefully considering and designing our future.