Daily insights for city builders, delivered every morning at 6 AM ET. I’m Brandon Donnelly — a Toronto-based real estate developer and founder of Globizen. I’ve been writing here since 2013.

Tag: north america

  • Elevators in North America are broken

    It was not my intention to make this building code week on the blog, but for some reason that has happened. So let’s continue. Here is an interesting guest essay — about elevators — written by Stephen Smith for the New York Times.

    Stephen is the founder and executive director of a Brooklyn-based non-profit called the Center for Building in North America. And what they do is conduct research on building codes, specifically in the United States and Canada, and then advocate for reforms.

    Here’s what he thinks about elevators (taken from the above essay):

    Elevators in North America have become over-engineered, bespoke, handcrafted and expensive pieces of equipment that are unaffordable in all the places where they are most needed. Special interests here have run wild with an outdated, inefficient, overregulated system. Accessibility rules miss the forest for the trees. Our broken immigration system cannot supply the labor that the construction industry desperately needs. Regulators distrust global best practices and our construction rules are so heavily oriented toward single-family housing that we’ve forgotten the basics of how a city should work.

    Here’s how the US compares to a few European countries:

    Nobody is marveling at American elevators anymore. With around one million of them, the United States is tied for total installed devices with Italy and Spain. (Spain has one-seventh our population, 6 percent of our gross domestic product and fewer than half as many apartments.) Switzerland and New York City have roughly the same population, but the lower-rise alpine country has three times as many single-family houses as Gotham — and twice as many passenger elevators.

    And here’s a set of cost comparisons:

    Behind the dearth of elevators in the country that birthed the skyscraper are eye-watering costs. A basic four-stop elevator costs about $158,000 in New York City, compared with about $36,000 in Switzerland. A six-stop model will set you back more than three times as much in Pennsylvania as in Belgium. Maintenance, repairs and inspections all cost more in America, too.

    If you’re interested in this topic, I would encourage you to give the full article a read. It’s highly relevant to our ongoing discussions around missing middle housing. If cities, like Toronto, hope to build a lot more apartment buildings (especially smaller-scale ones), they are going to need affordable and plentiful elevator options.

    (Thanks to Michael Visser for sharing this article me.)

  • San Francisco is highly proficient at making housing more expensive

    If you’re looking to block new development, drive up the cost of housing, and appear “progressive” all at the same time, one generally effective technique is to do it under the guise of historic preservation. San Francisco is really good at this, as are many other cities. And it works because, who doesn’t think that history is important?

    This exact thing just transpired in San Francisco, where earlier this year Supervisor Aaron Peskin passed an ordinance enacting new density controls for most development in the Northeast Waterfront Historic District, the Jackson Square Historic District, and the Jackson Square Historic District Extension (solid neighborhood names).

    Of course, sometimes you can run into resistance when you’re trying to push through new anti-housing policies. And in this case, San Francisco Mayor London Breed actually vetoed Peskin’s bill. In a letter dated March 14, 2024, she wrote:

    Restricting new housing runs counter to the goals of our Housing Element, which the Board of Supervisors unanimously approved just over a year ago. It also runs counter to what we need to do to make this City a place that creates opportunities for new homes for the people who need them today and for future generations growing up in San Francisco.

    This ordinance passes off anti-housing policy in the guise of historic protections. Existing rules already protect against impacts to historic resources. I believe we can add new homes while also supporting and improving the vibrancy of our unique neighborhoods. Many areas of San Francisco, including eastern neighborhoods like the South of Market, Potrero Hill, and the Mission, have also already removed density limits to encourage new housing.

    However, her veto was ultimately overridden by the Board of Supervisors and so, as far as I understand it, the above density controls stand.

    What’s particularly frustrating about this outcome — sarcasm now firmly off — is that it so obviously reeks of NIMBY selfishness. Here’s an elaborate infographic created by Max Dubler explaining what many in San Francisco believe is the real reason behind this downzoning:

    Here is also a street view image from the area, along The Embarcadero:

    But like I said, San Francisco seems to be really adept at this sort of maneuvering.

  • Floor numbering conventions

    One of the things that is common in Europe is that building floors often start with zero for the ground floor and then go both up and down from there.

    This is different than most of North America where the ground floor is usually floor number 1 (regardless of what it might be called) and then the floors go up from there.

    Using the pictured example (above), the key difference is that, with the ground floor as zero, you end up with the above-grade floors being off by 1 and the top floor being 6 instead of 7.

    There is a certain rationality to the European approach that I like, but I am curious how suites on ground floors get typically numbered. I will seek this out and report back.

    At Junction House, our ground floor residences follow 101, 102, 103, etc. Following the exact same logic, the European equivalent would be 001, 002, 003, etc. This, admittedly, feels a bit odd.

    Which floor convention do you find more intuitive?

    Either way, I’m thinking about adopting the European approach for no other reason than that height is a sensitive topic in the world of development, so one less “headline” floor could be helpful. (Half-joking)

  • Electric vs. internal combustion engine

    Porsche released its first electric car back in 2019. It was the 2020 Porsche Taycan, which was fairly similar to the Porsche Panamera sedan in terms of price, performance, and styling, except that it was fully electric. So if you were in the market for a very expensive sedan, it was more about whether or not you wanted an electric vehicle or a vehicle with an internal combustion engine (ICE).

    In the quarter in which it launched (Q4 2019), the Taycan ended up only representing about 7% of Porsche North America’s overall sedan sales. But by the second quarter of the following year it was nearly 50%. And in the first quarter of this year (2021), it was over 80% of their sedan sales. That was fast. Pretty soon, I would imagine there will be no point in even making the Panamera.

    Now, the Panamera and Taycan aren’t exactly mainstream vehicles. But I found the above chart (which is from Bloomberg Green) interesting in that it feels like an all-things-being-equal kind of question. If you happen to be in the market for a six-figure Porsche sedan — and all things are kind of equal — would you rather an electric model or one that runs on gas? Already most people are choosing the former.

  • Measuring street-network disconnectedness around the world

    Here is a recent research paper by Christopher Barrington-Leigh and Adam Millard-Ball that looks at the connectivity of local street networks across the world. They refer to this as “street-network sprawl” and they measure it using a Street-Network Disconnectedness index (SNDi).

    This is important for many reasons. Compact street networks with shorter blocks and fewer dead ends are far more conducive to different forms of mobility, including transit. Street networks are also incredibly sticky. Once laid, they rarely change. And if they do, it’s over very long periods of time.

    The study period in the paper is 1975 to 2013. What they found is that in 90% of the 134 most populous countries in the world, the street network has become less connected since 1975. What this means is that we have been making it harder to service our communities with transit.

    That said, there has been a reversal in “high income” countries, most notably in North America. If you take a look at the above graphs, you can see a fairly dramatic drop off, signalling a reduction in the construction of low-connectivity streets. Southeast Asia, on the other hand, is trending in the opposite direction. Note Bangkok in the upper righthand corner.

    For a copy of the full research paper, click here.

    Images: Global trends toward urban street-network sprawl

  • Eliminating single-family zoning

    There is something happening in many North American cities right now. We are starting to question the supremacy of zoning for only single-family homes.

    This past summer, the state of Oregon passed policy requiring cities of 25,000 people or more to allow duplexes, triplexes, and fourplexes within their single-family home neighborhoods. Minneapolis is poised to do something similar with its Minneapolis 2040 plan (though it has been contentious). And, of course, here in Toronto we recently rolled out laneway suites all across the city. Small scale multi-family dwellings are also already permissible in some areas (though few are being built).

    Some are calling this a YIMBY movement. But however you want to define it, it’s an acknowledgement that, if the goal is to built up instead of out, perhaps it’s time we look at the parts of our cities with the lowest population densities. I would also add that following my recent post on Paris vs. Vancouver, many seemed to gravitate (in the comments) toward the Parisian model — even if it did result in over 50,000 people per square kilometer. Density, it would appear, is okay.

    While positive, it remains to be seen whether these policy changes will result in a meaningful increase in housing supply. And a lot of that will come down to the details. As I have said before on the blog, the math can be challenging on these sorts of smaller projects, which is why you have smart people proposing things like an “inverse density” rule to help encourage more smaller scale development.

    But as the saying goes, sometimes you need to crawl before you can walk. And, if nothing else, there’s certainly symbolic value to what seems to be taking hold across North America right now.

  • My life as a tram

    Love them or hate them (I happen to love them), Toronto’s streetcars are part of this city’s identity. Most North American cities got rid of their streetcars around the middle of the 20th century. But Toronto didn’t. And that has left us with the largest first generation streetcar network in the Americas in terms of total track length, number of cars, and ridership. That’s something. If you’re also a fan of streetcars (or just like geeking out about cities), you may enjoy this little ode to Zürich’s tram network by Monocle. It’s called, “My life as a tram.”

  • The capital of the future: Shanghai

    Joe Berridge’s recent opinion piece in the Globe and Mail makes the case for why Shanghai is destined to become “the capital of future.” Brash city building, massive scale, and entrepreneurial hustle are among some of the reasons why he believes the city is on a path to global supremacy. And similar to other great capitals, it has benefited from a strategic geographic position on an important waterway — in this case the Yangtze River.

    By way of comparison, Toronto is said to be the fastest growing urban region in both North America and Europe right now. We add somewhere around 125,000 people each year. Shanghai, on the other hand, is adding between 700,000 and 800,000 people each year — much of it from internal migration. The city currently has a population of around 24 million people and it is expected to grow to somewhere between 35 and 45 million people by 2050. (Figures from the Globe.)

    Notwithstanding all of our successes as a global city region, as I was reading Berridge’s piece I couldn’t help but come back to this comparison. Shanghai opened its first subway line in 1993. Today it has one of the most extensive networks in the world; whereas, it would probably take Toronto this long to figure out if that first line should be light rail or a below-grade subway. And we haven’t even gotten to the number of stops yet.

    But that’s one of the differences between top-down and bottom-up city building: speed.

    Photo by Denys Nevozhai on Unsplash

  • Documenting a city

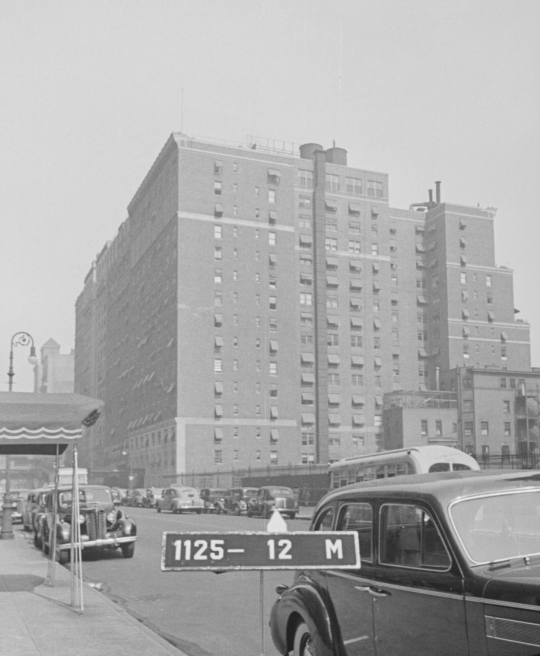
    Starting in the late 1930s, New York City began hiring photographers to document each and every building in the city. It did this to improve the accuracy of its tax assessments, and so every photo was taken with a sign board indicating the building’s block and lot number. The photos looked like this (taken from here):

    image

    The initiative produced over 700,000 black and white photos, all of which have been recently digitized according to the New York Times. The Times also recently published this interactive piece where they go back to these archival photos to see how the city has and hasn’t changed. 

    In the late 1930s and early 1940s, documenting a city and its buildings was clearly a manual endeavor. Today we have Google Street View (launched in 2007), which has now photographed much of the world. Many countries, including all of North America, are reported as having “mostly full coverage.”

    But already autonomous vehicles (and their supporting services) are starting to scan and map our cities in new ways. So it will be interesting to see what ends up getting built on top of this data. I am certain it will empower much more than just better tax assessments.

    Happy New Year, friends. Thanks for reading over the last year.

  • Tech and the North American office market

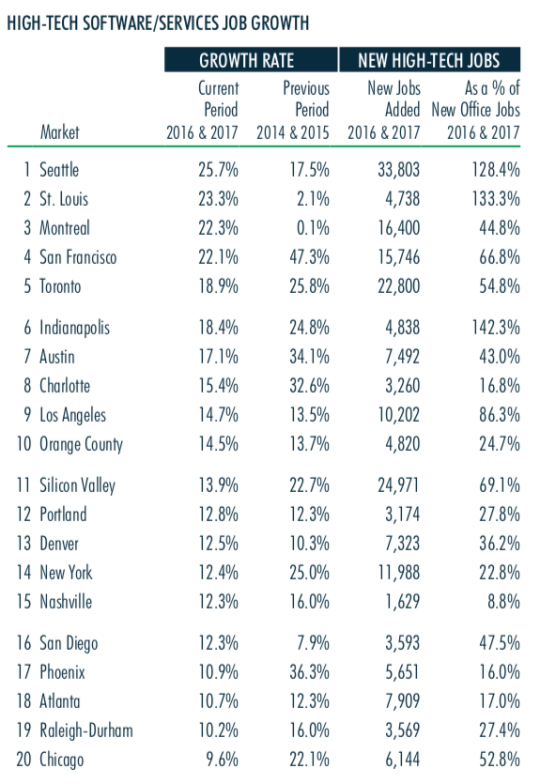
    CBRE recently published this report looking at the impact of the “high-tech software/services industry” on the North American office market. 

    Here are a few highlights:

    – Since 2010, tech has created ~1.1 million jobs in the US at an annual growth rate that is 3x the national average.

    – Seattle currently has the fastest tech job growth in North America. This is the first time in 7 years that San Francisco hasn’t been at the top of their list.

    – Silicon Valley, Toronto, New York, and Los Angeles all added more than 10,000 tech jobs from 2016 to 2017.

    – The biggest “momentum markets”, relying on 2016 and 2017 data, are Montreal, St. Louis, and Seattle.

    – Over the past two years (Q2-2016 to Q2-2018), Atlanta, Los Angeles, Orange County, Seattle, and Portland have all seen double-digit rent growth.

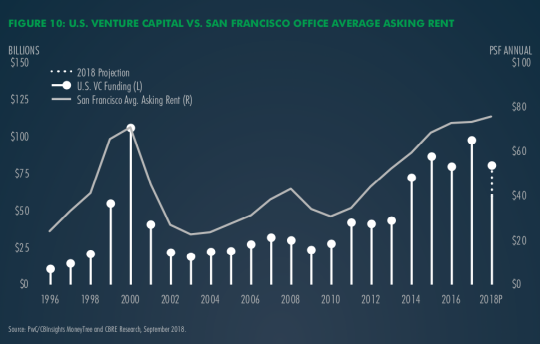
    One figure that also stood out for me was this one here showing the relationship between US venture capital investment and the average asking rent for office space in San Francisco.

    If you’d like to download the full report, click here. You’ll need to sign up for an account with CBRE, but it’s free to do that.