Daily insights for city builders, delivered every morning at 6 AM ET. I’m Brandon Donnelly — a Toronto-based real estate developer and founder of Globizen. I’ve been writing here since 2013.

Tag: mit senseable city lab

  • The minimum parking problem for on-demand mobility

    There is data to suggest that on-demand (OD) mobility services — such as Uber — are increasing vehicle kilometers traveled (i.e. causing greater traffic congestion) by inducing people away from public transit and other forms of urban mobility. This is potentially even more of an issue right now with most urban transit agencies looking at massive budget shortfalls.

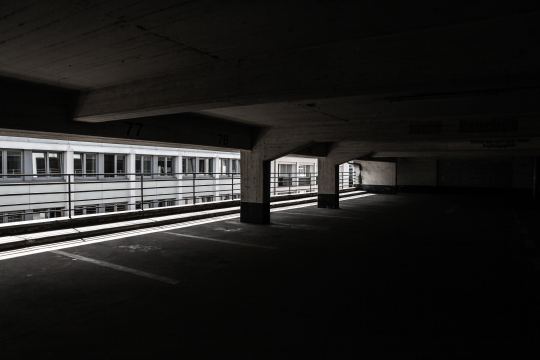
    But there’s potentially another way to look at this problem. A recent study led by Dániel Kondor of the MIT Senseable City Lab has looked at not only vehicle kilometers traveled but also something that the team calls the “minimum parking problem.” What is the minimum amount of parking that you need assuming a world with more on-demand mobility, and eventually autonomous vehicles?

    To try and answer this problem the researchers looked at the small city-state of Singapore. With a population of about 5.6 million people and somewhere around 1 million vehicles, Singapore actually has one of the lowest number of private vehicles per capita in the developed world. Even still, it has some 1.37 million parking spaces taking up valuable room.

    What the team found was that on-demand mobility could reduce parking infrastructure needs in Singapore by as much as 86%. This is the absolute minimum number, which would take the current estimate of 1.37 million spots down to about 189,000 — a significant reduction.

    However, the tradeoff is that it could increase vehicle kilometers traveled by about 24%. Without ample parking, their model assumes that these on-demand vehicles would need to “deadhead” between trips. That is, drive around aimlessly while they wait for their next passenger. Demand isn’t usually neat and tidy.

    However, it’s worth noting that the above percentage increase assumes that if people were instead driving themselves around that they always found a parking spot as soon as they arrived at their destination. This, as we all know, is not often the case, and so this increase is probably a worst case scenario.

    Nevertheless, the team did also find that a 57% reduction in parking could be achieved with only a modest 1.3% increase in vehicle kilometers traveled. This, to me, is meaningful because it says that you could, in theory, cut parking supply in at least half and not much would happen in the way of traffic congestion.

    It would, however, free up a bunch of space for things like bicycle lanes, green space, and other valuable urban amenities. Now, if on-demand vehicles are pulling people away from transit, then maybe we’re no better off. But if the alternative is people driving and parking everywhere they go, then it would seem that there are much better uses for that space.

    Photo by Jordi Moncasi on Unsplash

  • Tracking epidemics in cities

    The last thing you probably need at this point is another webinar. But this one could actually be interesting. On May 29th, 2020 at 9:00 AM eastern, the Senseable City Lab at MIT is hosting one called, Tracking epidemics in cities: urban environments and the insights they provide into disease. The Senseable City Lab has previously looked at how sewage could be mined for real-time information about an urban population, revealing things like eating habits, genetic tendencies, drug consumption, and — yes — contagious diseases. In this webinar, SCL plans to pickup on this last point, as well as discuss how mobile phone patterns can help to inform epidemiological studies. If you’d like to register, click here.

    Image: SCL

  • Examining the solar potential of cities

    The MIT Senseable City Lab recently asked: How does urban morphology affect the solar potential of cities? If you assume that transparent photovoltaic cells are on the way and that building facades are soon going to become a place where we generate solar energy, then this is actually a pretty interesting question. Are some built environments naturally better suited than others?

    To answer this question, they looked at the “urban surfaces” of ten cities, including New York, Singapore, Toronto (pictured above), Hong Kong, Paris, as well as others. These surfaces included roofs, facades, and ground planes.

    What they, not surprisingly, discovered is that you need a lot of exposed facades to get the numbers up. And so the cities that come out on top in terms of annual solar irradiation are cities like New York and Singapore. They have a lot of tall buildings, but they also fluctuate in height, giving greater exposure to the facades.

    All of this is potentially relevant because — if building facades become a big deal for solar — it could start to inform how we plan our cities. In fact, I would go so far as to bet that, over the long-term, solar energy will have a greater impact on urban morphologies than this current pandemic.

    Image: MIT Senseable City Lab

  • Social and physical segregation in Singapore

    A recent study by the MIT Senseable City Lab has used cellphone data to map both social and physical segregation within Singapore. To start, they used residential sale prices as a proxy for socioeconomic status. They then used call and text records (presumably it was all anonymous) from 1.8 million cellphone users in Singapore (2011) to map who interacted with who. Pictured above is one of those mappings.

    What they discovered was evidence of a “rich club effect.” In other words, the richer the person the less likely they were to interact with people outside of their socioeconomic band. The study calls this their communication segregation index.

    A similar phenomenon was noted as people moved around Singapore. (This is the study’s physical segregation index.) People tend to spend time in spaces alongside people with similar socioeconomic attributes. However, they did notice that this tends to wane during the day as people move around the city — presumably for work and other such things.

    I think it would be interesting to get a bit more granular about the findings in order to try and see, among other things, if certain public spaces are more successful than others at encouraging a broader socioeconomic mix. And it’s probably only a matter of time before we start using tools like this to plan our cities. For more on the study, click here.

    Image: MIT Senseable City Lab

  • Tasty data

    A recent study and research paper by the MIT Senseable City Lab — called, Tasty Data — has discovered that restaurant data alone can be used to accurately predict location-based factors such as daytime population, nighttime population, number of businesses, and overall consumer spending within a specific geography.

    They started by pulling restaurant data from Dianping (Chinese equivalent of Yelp) for 9 Chinese cities: Baoding, Beijing, Chengdu, Hengyang, Kunming, Shenyang, Shenzen, Yueyang, and Zhengzhou. They then paired their Dianping data with other available data (such as aggregated mobile phone data) and used machine learning to search for any correlations.

    Below is a diagram of “nighttime population” in Beijing. They are using a 3 km2 grid.

    If you’re a regular reader of this blog, you’ll know that I like these kinds of studies. By 2020, it is estimated that 1.7MB of data will be created every second by every person on earth. The numbers are staggering. And yet, “official” data sources, such as census data, remain slow and fairly limited. Studies like this one continue to show us what’s next.

    Image: MIT Senseable City Lab

  • The sensing power of taxis

    The latest project out of MIT’s Senseable City Lab examines the “sensing power of taxis” in various cities around the world. Looking at traffic data, they determined how many circulating taxis you would need to equip with sensors if you wanted to capture comprehensive street data across a particular city. This might be useful if you wanted to measure things like air quality, weather, traffic patterns, road quality, and so on.

    What they found is that the sensing power of taxis starts out unexpectedly high. It would only take 10 taxis to cover 1/3 of Manhattan’s streets in a single day. However, because taxis tend to have convergent routes, they also discovered rapid diminishing returns. It would take 30 taxis (or 0.3% of all taxi trips) to cover half of Manhattan in a day, and over 1,000 taxis to cover 85% of it. A similar phenomenon was observed in the other cities that they studied: Singapore, Chicago, San Francisco, Vienna, and Shanghai.

    However, if you look at the percentage of trips needed to scan half of the streets in a city, Manhattan has the lowest rate at 0.3%. Vienna is the highest at 9%. But I’m not sure if this is a function of the utilization rate of their taxis or if it has something to do with urban form. Singapore has a similarly low rate (0.44%), but its street grid looks nothing like that of New York’s.

    Here’s a short video explaining the project:

  • Forum on Future Cities: Urban Intelligence

    MIT Senseable City Lab and the World Economic Forum’s Global Future Council on Cities and Urbanization are hosting a conference next month on the impact that artificial intelligence is having on our cities. Here is a summary of the event:

    As AI (Artificial Intelligence) becomes ubiquitous, it transforms many aspects of the environment we live in. In cities, AI is opening up a new era of an endlessly reconfigurable environment. Empowered by robust computers and elegant algorithms that can handle massive data sets, cities can make more informed decisions and create feedback loops between humans and the urban environment. It is what we call the raise of UI (urban intelligence).

    The 2019 Forum on Future Cities, organized by MIT Senseable City Lab and the World Economic Forum’s Global Future Council on Cities and Urbanization, will focus on four aspects of the UI transformation: autonomous vehicles, ubiquitous data collection, advanced data analytics, and governing innovation. Panelists include mayors, academics, senior industry leaders and members of civil society to explore such topics from different points of view, highlighting the scientific and technological challenges, the critical collective decisions we as a society will have to make, and the exciting possibilities ahead.

    The forum takes place on April 12th in Cambridge, Massachusetts. And since it looks to deal with many of the topics that we talk about on this blog, I figured that some of you might be interested in attending. If so, you can register here.

  • Good vibrations

    image

    There are 614,387 bridges in the United States and 55,707 of them are thought to be structurally deficient according to the US Department of Transportation (2016). About 188 million people cross “a deficient bridge” every day in the US (also a 2016 figure).

    Inspections are often infrequent and only visual, and so MIT Senseable City Lab is currently on a mission to come up with a more scientific approach. They believe that there’s a solution in crowd-sourced data and that it’s possible to create a community-driven maintenance program.

    What they discovered through a recent study, called Good Vibrations, is that mobile phone sensors can actually pick up the natural vibrations and oscillations of a bridge. And, that a mobile sensor located within a traveling car is actually 120x more precise than fixed sensors located on the bridge.

    Part of the problem is that fixed sensors have poor spatial coverage. They are located in specific locations. Whereas mobile sensors give you data across the entire span of the bridge as someone crosses it. And if you know how a bridge normally vibrates, you can quickly tell when something is off. 

    Here’s a quick video overview of the study. And here’s what you should do if you want to get involved.

    Photo by Joseph Barrientos on Unsplash

  • Downward pressure on parking supply

    There’s a significant amount of downward pressure on parking supply in most major cities. Part of this has to do with the push toward more sustainable forms of transport, which is, of course, a good thing. But it also has to do with rising construction costs, the fear of obsolescence in the wake of autonomous vehicles, and probably many other factors.

    Developers, ourselves included, have responded by being cautious about the amount of parking being provided and by considering alternative future uses for the parking that is being built. I think it is also obvious that we will continue to see more, rather than less, parking stackers and other more efficient parking solutions.

    So far the cost of parking in dense urban centers has continued to rise. A new parking spot in the core of Toronto priced at $100,000 would not surprise me. And Hong Kong recently set a record for what is allegedly the most expensive parking spot in the world: USD 765,000 or CAD 1 million.

    But what is going to happen going forward?

    Researchers at the Singapore – MIT Alliance for Research and Technology and MIT Senseable City Lab, along with Allianz, have recently tried to quantify what the impact of autonomous vehicles will mean on required parking, and on traffic, in Singapore. The study is called Unparking.

    Today, they estimate the total number of parking spots in Singapore to be around 1,370,000. This is based on minimum parking requirements from the Housing Development Board and on the idea that home-work commuting consumes two parking spots: one at home and one at the office.

    They model four different scenarios, but the last one is based on fully autonomous vehicles and on shared parking spaces. Holding current mobility demands and traffic volumes constant, the demand for parking in this scenario drops by 70%.

    It is possible to reduce the number of parking spaces even further to 85%, but this has a negative impact on traffic congestion in their model. Fewer parking spaces means the autonomous vehicles have to drive around more picking people up. 

    I also don’t know if there was any consideration given to induced demand as a result of the more affordable autonomous vehicles. Demand for transportation services is generally thought to be fairly elastic.

    Whatever the case may be, numbers are made to be questioned. And Singapore is a unique city-state. But ¼ the amount of parking does not seem that far fetched to me.

    Photo by Tobias Jussen on Unsplash