Daily insights for city builders, delivered every morning at 6 AM ET. I’m Brandon Donnelly — a Toronto-based real estate developer and founder of Globizen. I’ve been writing here since 2013.

Tag: minneapolis

  • Why is housing viewed so differently?

    Here is a study by three researchers out of California that asked Americans to predict the impact of a supply shock on various things, such as durable goods, commodities, labor, trade, and yes, housing.

    For basically all of these items, people tended to answer correctly. Usually by a factor of at least two to one. In other words, when asked what reducing the supply of new cars would do to the prices of used cars, the majority of people responded saying that it would lead to an increase in prices.

    However, when asked about the impact of a 10% increase in housing supply, about 40% said that it would cause prices and rents to rise. Only about a third believed they would fall (the correct answer). This is fascinating because it shows that housing seems to be an outlier. Most people don’t have the same intuitive sense.

    Why is this? Well, one commonly held belief is that building market-rate housing leads to gentrification, and that this ultimately leads to the displacement of existing residents. This might have been why some people responded saying that new housing will cause an increase in prices and rents. It’ll lead to all housing going up.

    However, there’s research to support that this isn’t the case. The problem isn’t outward displacement following new market-rate housing. The greatest driver of gentrification is actually “exclusionary displacement”, which is the inability of people to move into areas because of a lack of housing. (This study was based on 2010-2014 housing data from the UK.)

    The thing about housing supply is that it relieves pressure across the entire market. Instead of a high-income person buying an old home to renovate (and causing outward displacement), they can instead choose to buy a new home (and not cause any outward displacement).

    By doing this, they also leave behind a home that can then be absorbed by lower earners. One US study found that for every 100 new market-rate homes that are built, somewhere between 45 and 70 people move out of a below-median income neighborhood.

    It is for reasons like these that, time and time again, increased housing supply has been shown to moderate home prices and rents (see above regarding Minneapolis and the Midwest as a whole). So if you’re worried about the cost of housing, the answer is to build more. And if you’re worried about gentrification, the answer is also to build more.

    Our intuitions are telling us that this is true for most things. But for whatever reason, housing feels different. It’s not, though.

    Source: The charts and studies in this post are from this great FT article by John Burn-Murdoch.
  • Eliminating single-family zoning

    There is something happening in many North American cities right now. We are starting to question the supremacy of zoning for only single-family homes.

    This past summer, the state of Oregon passed policy requiring cities of 25,000 people or more to allow duplexes, triplexes, and fourplexes within their single-family home neighborhoods. Minneapolis is poised to do something similar with its Minneapolis 2040 plan (though it has been contentious). And, of course, here in Toronto we recently rolled out laneway suites all across the city. Small scale multi-family dwellings are also already permissible in some areas (though few are being built).

    Some are calling this a YIMBY movement. But however you want to define it, it’s an acknowledgement that, if the goal is to built up instead of out, perhaps it’s time we look at the parts of our cities with the lowest population densities. I would also add that following my recent post on Paris vs. Vancouver, many seemed to gravitate (in the comments) toward the Parisian model — even if it did result in over 50,000 people per square kilometer. Density, it would appear, is okay.

    While positive, it remains to be seen whether these policy changes will result in a meaningful increase in housing supply. And a lot of that will come down to the details. As I have said before on the blog, the math can be challenging on these sorts of smaller projects, which is why you have smart people proposing things like an “inverse density” rule to help encourage more smaller scale development.

    But as the saying goes, sometimes you need to crawl before you can walk. And, if nothing else, there’s certainly symbolic value to what seems to be taking hold across North America right now.

  • The most segregated cities in North America

    The Martin Prosperity Institute here in Toronto just released a new research study called Segregated City: The Geography of Economic Segregation in America’s Metros

    The report looks at the physical sorting and separation of advantaged and disadvantaged groups within cities. And it did so across 70,000+ Census tracts in the US and in terms of 3 different dimensions: income, education, and occupation.

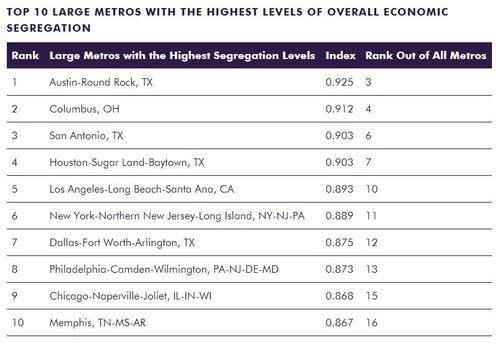
    Here are the most segregated “large metros” in the US:

    image

    Table Source: MPI

    And here are some of their broader findings – taken verbatim from page 9 of the study (click here for the full report):

    Economic segregation is positively associated with population size and density. It is also positively correlated to two other sets of factors that follow from metro size and density: how people commute to work and the breakdown of liberal versus conservative voters.

    Economic segregation tends to be more intensive in high-tech, knowledge-based metros. It is positively correlated with high-tech industry, the creative class share of the workforce, and the share of college grads. In addition, it is associated with two key indicators of diversity, the share of the population that is gay or foreign-born, which tend to coincide with larger, denser and more knowledge-based metros.

    Economic segregation is connected to the overall affluence of metros, with positive correlations to average metro wages, income, and economic output per capita.

    Race factors in as well. Economic segregation is positively associated with the share of population that is black, Latino, or Asian, and negatively associated with the share that is white.

    Economic segregation is associated with income inequality and even more so than with wage inequality. Its effects appear to compound those of economic inequality and may well be more socially and economically deleterious than inequality alone.

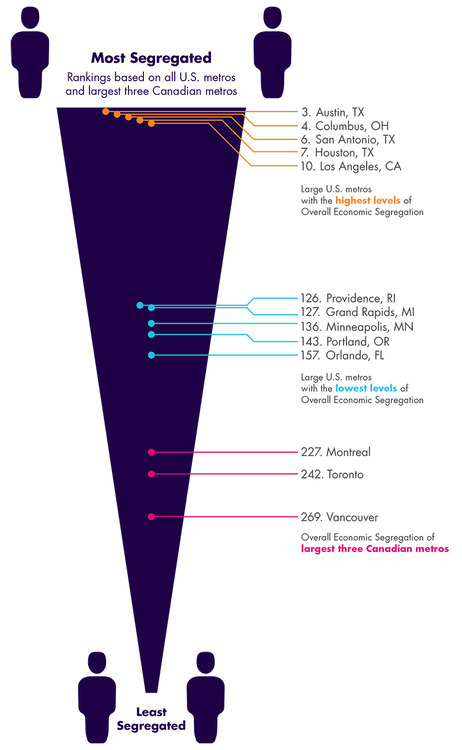
    The research team also looked at how Canada’s 3 largest metros – Toronto, Montreal, and Vancouver – compare to those in the US in terms of segregation. 

    The finding was that Canadian cities are overall less segregated than US cities, but that it should still be considered an area of concern. The most segregated of Canada’s 3 largest metros was found to be Montreal.

    image

    Image Source: MPI

    My view is that our economy is going through a profound shift right now. We’re transitioning from the industrial age to the information age. And in its wake, we’re seeing a number of disruptions, one of which appears to be rising inequality and segregation. 

    That’s not to say that I think this transition is a bad thing (I don’t think it is), but I do think we should be carefully considering and designing our future.

  • Top 10 (US) cities for young smart people

    image

    I’m always on the lookout for great websites and communities dedicated to cities. And today, thanks to a friend of mine, I found a new one called City Observatory. It’s my new favorite site for city geeks.

    They describe themselves as a “data-driven platform for sharing, analyzing and discussing the success of cities.” As soon as I read that, I immediately subscribed. I’m a big believer in using data to elevate the discussions happening around our cities and to cut through the bullshit.

    I’m looking forward to digging into more of their articles, but I did already take a look at the first report they published, which is called: “The Young and Restless and the Nation’s Cities”. Click here to download the PDF.

    What the report talks about is a demographic group that they refer to as “Young and Restless”, and which they define as being 25-34 years old and having a 4-year degree. And they focus on this group because they see it as critical to driving local economic development.

    They’re the next generation who are going to start those companies and drive growth and innovation. And since the data shows that as people age, they become less willing to relocate (which intuitively makes sense), cities today are quickly realizing that they need to capture this group of smart people while they’re still restless (i.e. mobile).

    So if this is important, which cities (in the US) are winning right now? Here are the top 10 cities via City Observatory:

    1. Washington D.C. 8.1%
    2. San Francisco 7.6%
    3. Boston/Cambridge 7.6%
    4. San Jose 7.5%
    5. Denver 7.5%
    6. Austin 7.0%
    7. New York 6.6%
    8. Minneapolis 6.6%
    9. Raleigh 6.5%
    10. Seattle 6.1%

    The percentage represents the portion of the population that’s 25-34 years old and has a 4-year degree. I’ve just listed the cities here, but in reality they reference the entire metro areas.

    Do any of the cities on this list surprise you? None are surprises for me. It’s more or less what I would have expected to see, except maybe for the absence of Chicago (it’s 12th according to this ranking).

    Is your city doing enough to capture this group?

    Image: Flickr