Daily insights for city builders, delivered every morning at 6 AM ET. I’m Brandon Donnelly — a Toronto-based real estate developer and founder of Globizen. I’ve been writing here since 2013.

Tag: luxury real estate

  • The art of high-rise living

    Today, I’m excited to share that I’ll be attending the second annual Elevate event this December as an industry ambassador. This means I get to ride alongside industry celebrities like Norm Li. (He better be DJ’ing.)

    Put on by Zonda, in partnership with Livabl and ARCHITECT Magazine, the event is focused exclusively on “the art of high-rise luxury living.” Everything from the overall state of the housing market to how to sell branded residences.

    Here’s the agenda and here’s the list of speakers.

    I wasn’t able to attend last year, but I heard from a number of industry friends that it was very well done, which is why I agreed to participate this year. That now means I have a discount code you can all use if you’d like to attend — BRANDONVIP30.

    For those of you who like art and culture things, the event also happens to fall right after Art Basel. This was done on purpose, and so now you have at least two good reasons to be in Miami Beach in December.

  • A story about architecture, interiors, and branding

    I was recently having a debate with one of our architecture partners about the interrelationship between architecture, interiors, and branding. This came up because, in New York City, you almost need a name brand architect attached to your project in order to sell luxury condos.

    But this raises an interesting set of questions: How much value is driven by the quality of the architecture versus the architect’s brand? (Though, presumably you need the former in order to build the latter.) And how much of the value is actually just driven by the finishes (interiors) and the branding that you layer on after?

    This latter scenario is a depressing thought for architects. It is architecture as a kind of “empty vessel.” One that just gets dressed up for today’s Instagrammable moments. And I am sure that you can think of some examples of this. Not everything can be capital A architecture.

    But what is clear is that the most successful design-driven projects don’t think in this way. They are thoughtful and deliberate about each component, and they all work together to strengthen each other. Marketing, after all, is about telling the right story. It is always helpful when you actually have one to tell.

  • Prime residential pricing in 10 global cities

    The below graphs are taken from a recent (June 2019) report by Knight Frank on “prime” residential pricing across the world. They define “prime” as generally being the top 5% of each market by value. What these graphs show are the spread between the average price of a prime property and the top price achieved in that market.

    The most expensive market is Hong Kong. The average price of a prime property in 2018 was USD 4,251 per square foot (or USD 45,760 per square meter) and the top price achieved was in 2016 at USD 28,154 per square foot (or USD 303,051 per square meter).

    Using the 2018 average, a 350 square foot studio apartment would run nearly USD 1.5 million (or almost CAD 2 million), assuming there are “prime” studios available in the market. Remember, we are talking about the top end of the market.

    If you’d like to download a copy of the full report, you can do that over here.

  • New York’s “pied-à-terre tax” explained

    New York is close to implementing new “pied-à-terre tax.” If the bill passes, which the New York Times believes is likely, cities of a million or more people will be able to levy an additional property tax on non-primary residence homes worth $5 million or more. The additional tax would be based on the following sliding scale:

    So let’s say for argument sake that you own a pied-à-terre in New York City worth approximately $238 million. Based on the above, your additional tax would be $370,000 + [4% x ($238 million – ~$25 million)]. That’s almost $8.9 million. Most of the revenue from this tax is expected to come from this upper (and open-ended) valuation bracket.

    New York City estimates that the tax could bring in about $650 million annually. The state in turn believes it could then raise $9 billion in bonds. And the intent is that these additional funds could be used to fund things like transit and housing. I am curious how elastic the demand is for trophy real estate in New York.

    Another thing I noticed while reading up on this bill is that the New York State Senate has made it pretty easy to voice your opinion on proposed legislation. On the sidebar of every bill making its way through the system is a box that looks like this:

    This is probably the clearest engagement tool I have ever seen on a government website. Do you think something like this could work for new housing?

  • New York’s 8-figure apartments

    Whenever you’re starting to feel like real estate prices in your city are getting out of hand, just turn your attention to New York. It’ll make you feel better.

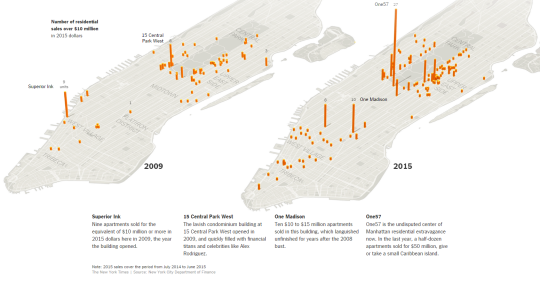
    The New York Times published an interactive overview of the Manhattan real estate market today. It was spurred on by the fact that the average residential sale price in Manhattan just hit $1.7 million (a new record) and that there’s a growing number of 8-figure apartments being bought up.

    Last year half a dozen apartments sold for more than $50 million in the One57 tower at 157 West 57th Street. (The New York Times calls this building the “undisputed center of Manhattan residential extravagance.”)

    Here’s one of their diagrams showing the number of residential sales over $10 million in 2009 and then in 2015:

    image

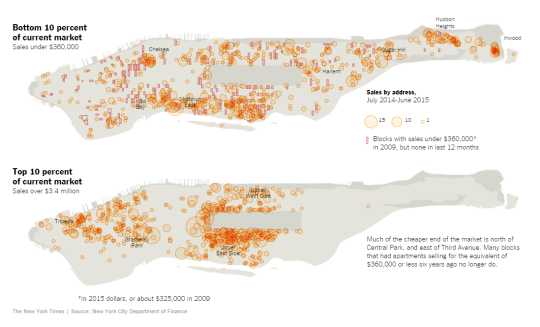
    And here’s another one of their diagrams showing the bottom and top 10% of the current market:

    image

    It’s interesting to see the clustering in certain areas and also the lack of clustering at the high end around the top of Central Park.

  • The world’s top 10 cities for prime property

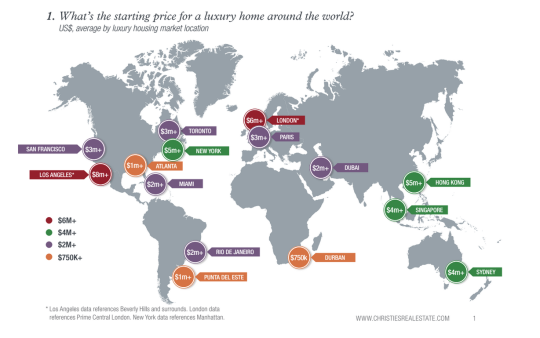
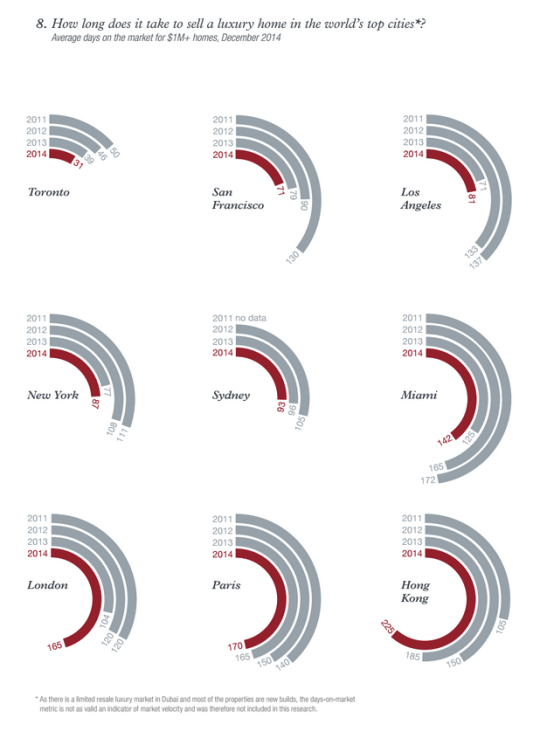
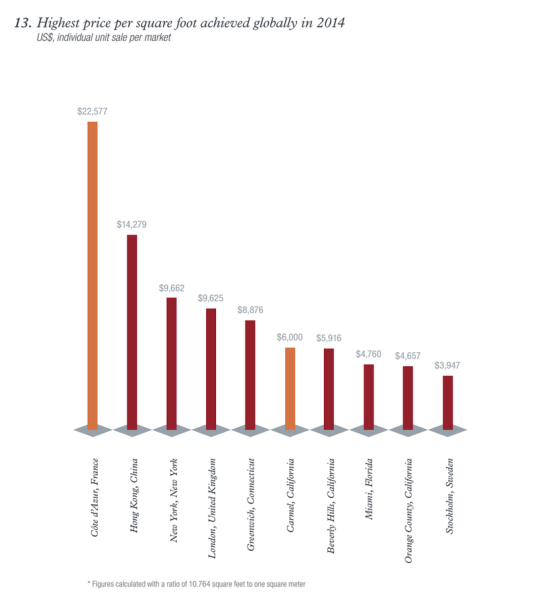
    This morning I read through a real estate report called Luxury Defined. It’s a look at the global luxury real estate market across “the world’s top 10 cities for prime property” and about 70 regional and resort destinations.

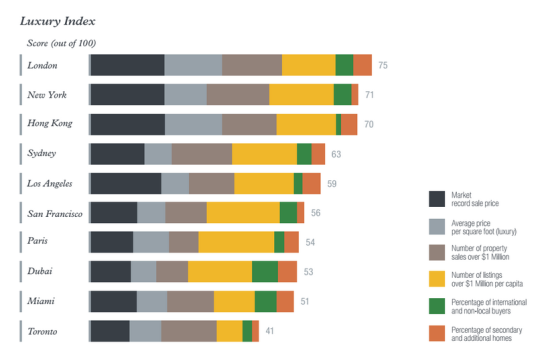
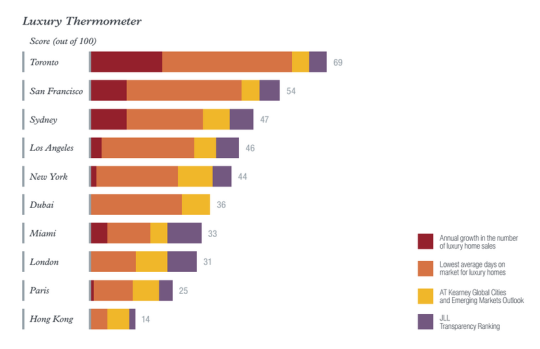
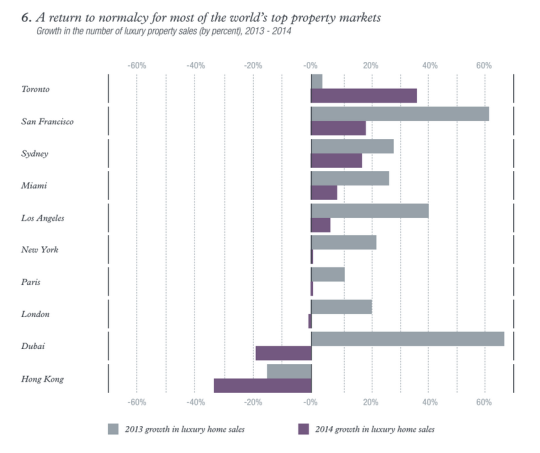
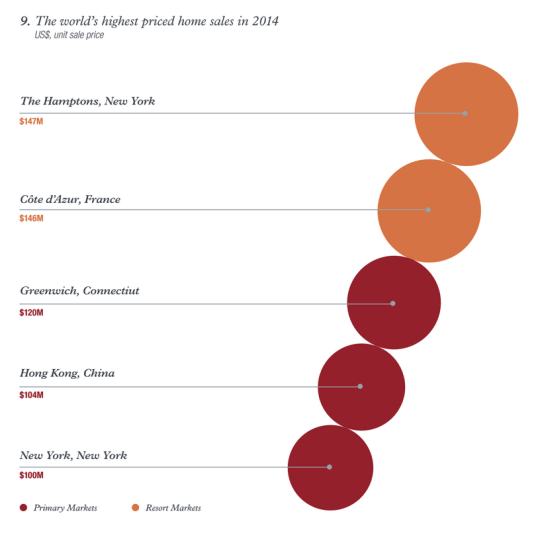
    It’s interesting to look at the trends and see how high-net-worth individuals (HNWIs) are choosing to allocate their funds in residential real estate. Here are some of the charts and diagrams that caught my eye as I was going through it (you may need to zoom your browser in):

    If you’d like to download the full report, click here. It’s free, but you’ll need to enter your name and email address.