Daily insights for city builders, delivered every morning at 6 AM ET. I’m Brandon Donnelly — a Toronto-based real estate developer and founder of Globizen. I’ve been writing here since 2013.

Tag: lse cities

  • Living in a denser London

    LSE Cities has just published a new report called, Living in a denser London: How residents see their homes. The goal of the research project was to better understand how modern housing projects are working (or not working) for Londoners. And so they connected with over 500 residents from 14 completed housing projects and got their feedback on everything from built form to community engagement. Most of the housing projects were completed in the last ten years, but they also surveyed projects from 1980, 1947, and 1902. If you don’t feel like going through the full report, there is also this website and this short film.

    Image: LSE Cities

  • A comparative analysis of global cities

    Since 2005, LSE Cities (London School of Economics) has been collecting comparative data on how global cities perform in terms of key spatial, socioeconomic, and environmental indicators.

    This is their latest data matrix:

    To be clear, it is not a ranking of cities. It is intended to help us better understand how different cities around the world are performing.

    Depending on how you’re consuming this post, the text may be difficult to read. So here’s what each column represents, moving from left to right:

    • Current population in the administrative city (millions)
    • Current population in the urban agglomeration (millions)
    • Average hourly population growth of urban agglomeration 2015 to 2030 (people per hour)
    • Administrative city area (km2)
    • Average density of built-up administrative area (people/km2)
    • GDP per capita in urban area ($, PPP)
    • Percentage of country’s GDP produced by the metro region
    • Population under 20 (%)
    • Murder rate (homicides per 100,000 inhabitants)
    • Percentage of daily trips made by public transport
    • Percentage of daily trips made by walking & cycling
    • Car ownership rate (per 1,000 inhabitants)
    • CO2 emissions (tonnes per capita)

    If you’d prefer to download a full PDF of the chart, click here.

  • Shaping Cities in an Urban Age

    Shaping Cities in an Urban Age is the third book to come out of the London School of Economic’s Urban Age project. It was published last fall. The first two titles were, Living in the Endless City (2011) and The Endless City (2007).

    If you’re familiar with the first two publications, you’ll know that these books are heavily illustrated. Lots of maps, charts, and diagrams. So they make great coffee table books. But they’re also filled with insightful essays — this one has 37 of them.

    In this particular book the focus is on the following:

    “It identifies current trends that are making cities more fragmented, less equitable and environmentally more damaging, and argues powerfully for a more integrated social, environmental and spatial approach that can inform and inspire city-makers that are shaping an increasingly urban world.”

    I am sharing this with all of you today because I have always really enjoyed these books. They have a way of quickly putting things into perspective globally.

    Around 2.5 billion more people are expected to live in an urban agglomeration by 2050. And 90% of this growth is expected to happen in just two places: Asia and Africa. This is an unprecedented shift that will obviously create many challenges and many opportunities.

    This book is about that.

    Image: Phaidon

  • Residential population densities compared

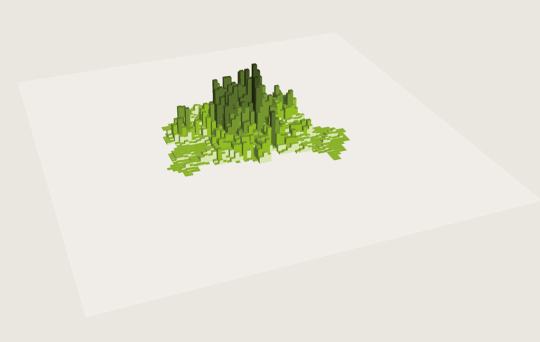
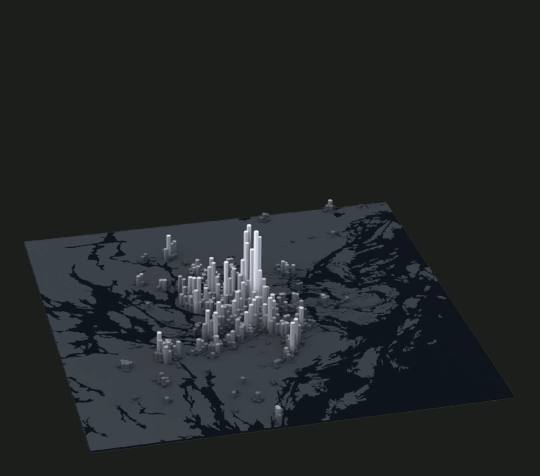
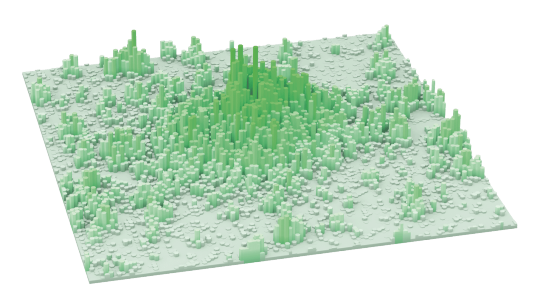
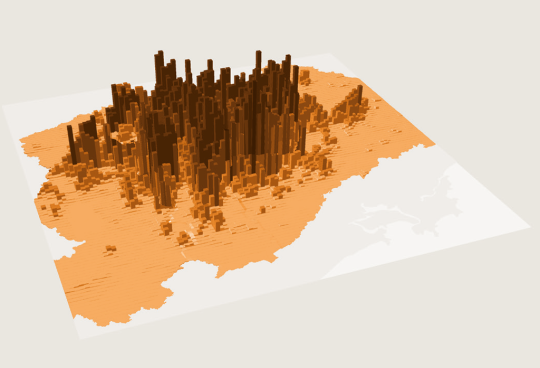
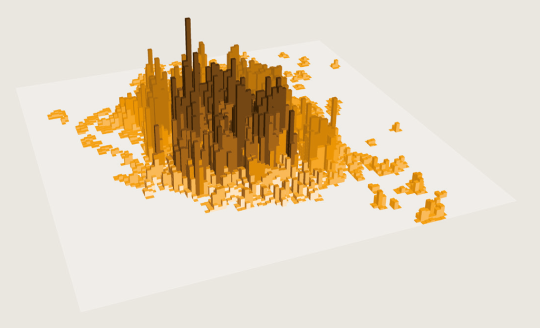
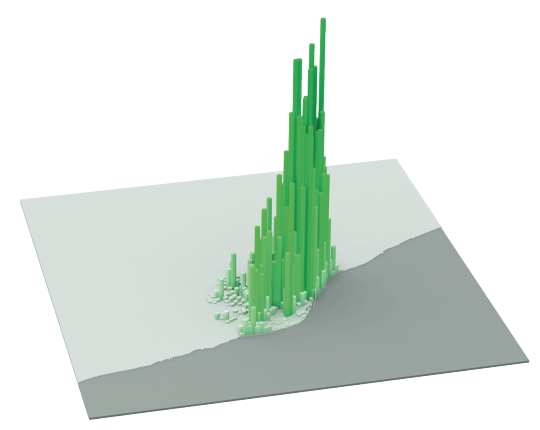
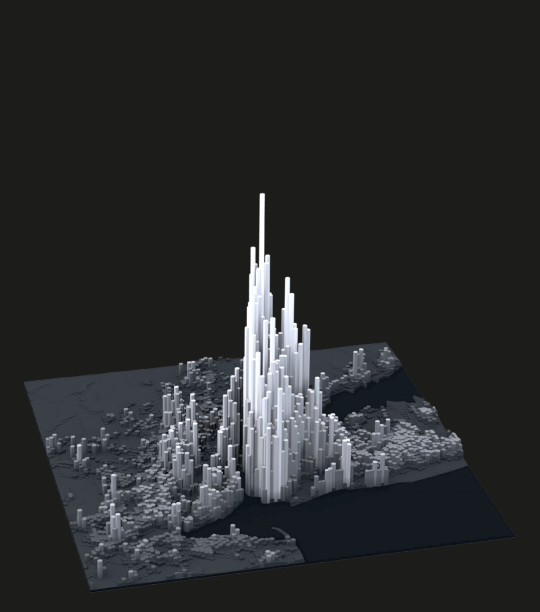
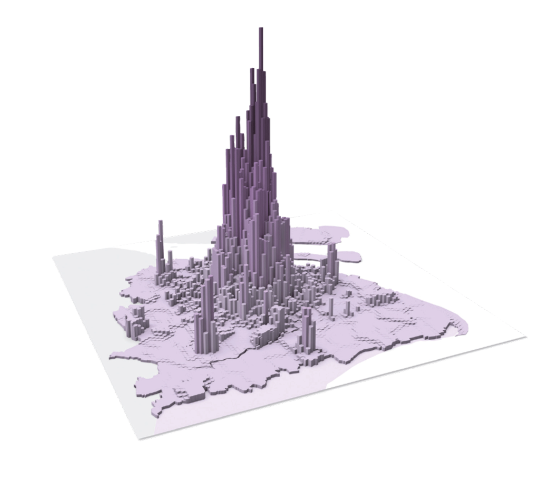
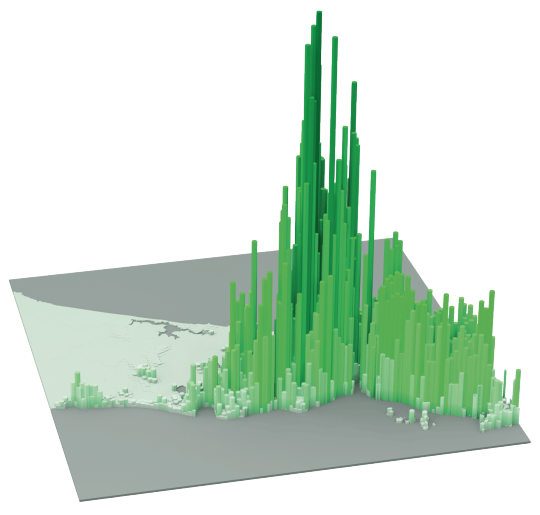
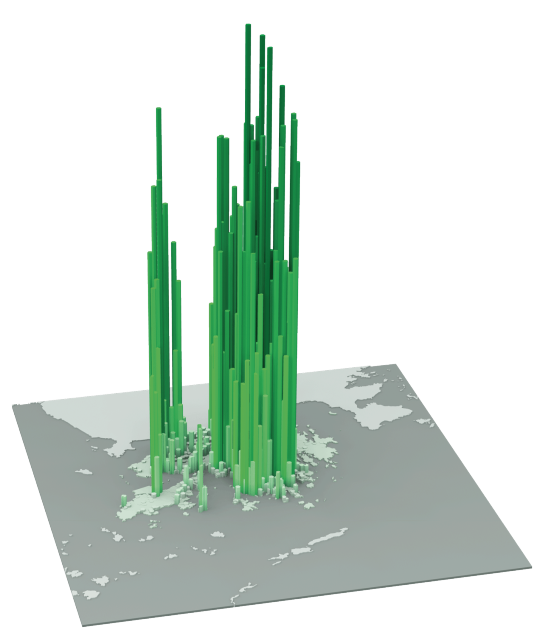
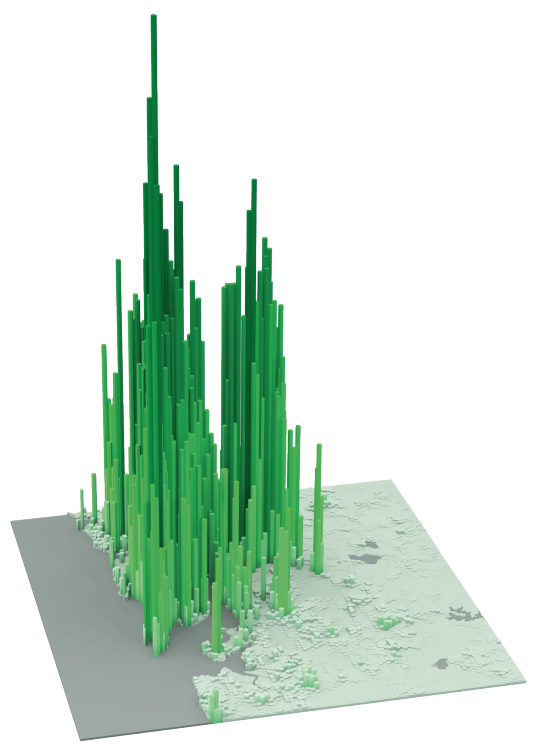
    The following diagrams were taken from LSE’s Urban Age website. I’ve sorted them from lowest to highest peak residential population density. In each case I’ve also included the year of the dataset. 

    It’s amazing how much these simple extrusion diagrams can tell you about the city. It also shows you that high population densities don’t necessarily need to equate to tall buildings. Barcelona, in particular, stands out for me.

    Berlin (Peak residential density: 21,700 people/km2, 2009)

    image

    Stockholm (Peak residential density: 24,900 people/km2, 2012)

    image

    London (Peak residential density: 27,100 people/km2, 2013)

    image

    São Paulo (Peak residential density: 29,380 people/km2, 2009)

    image

    Mexico City (Peak residential density: 48,300 people/km2, 2009)

    image

    Barcelona (Peak residential density: 56,800 people/km2, 2013)

    image

    New York (Peak residential density: 59,150 people/km2, 2012)

    image

    Shanghai (Peak residential density: 74,370 people/km2, 2011)

    image

    Istanbul (Peak residential density: 77,300 people/km2, 2013)

    image

    Hong Kong (Peak residential density: 111,100 people/km2, 2013)

    image

    Mumbai (Peak residential density: 121,300 people/km2, 2013)

    image

  • The rise of the East

    I love the work that LSE Cities (London School of Economics) is doing with Urban Age. If you haven’t yet checked out their site, you should do that now. If you’re a city geek, it’s the kind of site you can get lost in for hours. Especially if you’re a sucker for great diagrams like I am.

    Here’s one I found today that shows where cities are growing in the world:

    Each circle represents a city (well, metropolitan area). The dark green dot is the city’s population in 1950. The lighter green dot is the city’s population in 1990. And the yellow dot is the city’s projected population by 2025. Click here for a larger version of the map.

    What’s fascinating about this diagram is that you can so clearly see how the most significant population growth has shifted away from the West to the rest of the world and in particular Asia. That is, those dots have more yellow than green.

    We, of course, already knew this was happening. And population is just one dimension. But it’s still interesting to see this in diagram form. We are living through the rise of the East. And this diagram is a reminder of that.