Daily insights for city builders, delivered every morning at 6 AM ET. I’m Brandon Donnelly — a Toronto-based real estate developer and founder of Globizen. I’ve been writing here since 2013.

Tag: land use policy

  • A mapping of development potential in Toronto

    I first met Monika Jaroszonek in 2017, right before she started RATIO.CITY. Since then she has developed some pretty incredible tools for the city building space.

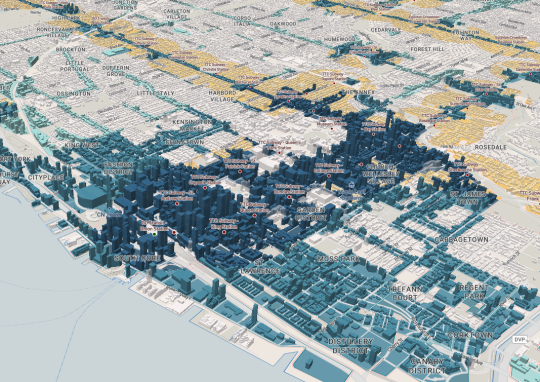
    Yesterday the company published this interactive visualization looking at development potential across the City of Toronto. The mapping looks for the following:

    The tool then ranks each development site – AAA, AA, A – according to how many of the above criteria it meets.

    It also flags land that it refers to as “Missed Opportunity.” These are lands located within 500m of a Major Transit Station, but that are designated as Neighbourhoods (considered stable) or Employment (whole other discussion).

    Based on this filter, about 5.6% of the City’s land is a “Missed Opportunity” and about 1.2% is AAA.

    When you look at the visualization, that is one of the first things you will probably notice; a lot of our transit infrastructure is currently underutilized as a result of land use policies.

    Image: RATIO.CITY

  • One year of Inclusionary Housing in Portland

    image

    About a year ago, Portland enacted “Inclusionary Housing” policy requiring new apartment buildings of 20 units or more to offer up a portion of the units at below market rents.

    Developers are able to select from a few different options and the rents are calculated according to a percentage of the city’s median family income (30-80%). I’m not sure how this policy would apply to new condo buildings.

    This is an interesting account by The Portland Mercury of what this policy may be doing to the housing market. I say may because it’s only been a year and there could be other factors at play.

    Between 2013 and 2017, Portland typically built between 3,000 and 6,000 new units per year. Since the IH policy went into effect on February 1, 2017, 682 new units have applied for permit. 

    About half are coming from one developer who appears to be building the requisite affordable units in exchange for no parking minimums. They are now proposing buildings with zero parking.

    Again, in all fairness, it’s only been a year. But already Mayor Ted Wheeler is looking at other incentives to encourage more new construction in the central city. The biggest levers: height and density.

    All of this begins to speak to the very real impact of inclusionary zoning on development feasibility.

    Photo by Zach Savinar on Unsplash

  • The impact of inclusionary zoning on development feasibility

    image

    After my recent post on inclusionary zoning in Ontario, I was asked to provide my comments on the draft regulation and on how inclusionary zoning could and will impact development feasibility. So I will endeavor to do that today.

    It’s important to first understand the costs and inputs that go into a development pro forma and how overall project feasibility is determined. For simplicity, let’s breakdown the costs as follows:

    – Land

    – Soft Costs

    – Financing Costs

    – Municipal Fees/Charges

    – Hard Costs

    All of these costs buckets are significant. For a project to be feasible, you obviously need the revenues of the project to be greater than the above costs. There also needs to be a remaining profit margin that is commensurate with the risk profile of the project and that meets your investor’s return expectations. Most developers rely on outside equity and debt to finance their projects.

    One of the misconceptions that I often hear is that people seem to think that the profit margin on projects is so great that developers could simply build affordable housing (or do many other things) if they weren’t so greedy. The reality is that development happens on the margin. It’s not easy to find sites and projects that make any sort of financial sense. More often than not they don’t.

    The other reality is that in a growing market all of the above costs are also continually increasing. If revenue (i.e. rents and condo prices) is also growing, as has been the case here in Toronto for many many years, then developers can generally absorb reasonable increases and continue building. But if revenue stops growing, grows at a slower pace or, worse, shrinks, then feasibility could disappear and development would stop.

    Now let’s talk specifically about inclusionary zoning. IZ is typically an incentivized or mandated requirement to provide a certain number of below-market housing units as part of new developments. Affordable housing is important. That’s why a number of cities already have inclusionary zoning policies – though it remains a fairly controversial tool.

    From a development feasibility standpoint, a mandatory inclusionary zoning requirement represents a decrease in revenue. There’s now a percentage of the units that can no longer be rented or sold at market prices. And so to maintain the project’s feasibility – because remember development happens on the margin – something has got to change.

    There are a few options.

    Option One: You could simply try and pay less for the land. As we have talked about many times on this blog, land is supposed to be the residual claimant. Work backwards from revenues and your other costs to determine what can be paid for the land. The problem with this option is that land prices tend to be sticky.

    Many or most landowners don’t give a shit about your development pro forma. They often have a number in mind and if you try and tell them that development charges just went up and you can’t pay as much for their land, they’ll simply sit on it and wait for someone else – even if that means waiting for the market to catch up (i.e. waiting for rents to go up).

    Option Two: Charge more for the remaining market units. If the market is sufficiently robust, perhaps this is an option. This is one of the reasons why inclusionary zoning often produces more units in markets where there’s already strong demand for new housing.

    But it’s also one of the reasons why IZ is controversial. You’re asking the other renters/buyers in the project to effectively subsidize the below market units. And there is research out there (previously posted on this blog) suggesting that in some instances IZ policies have created additional upward pressure on market rents and home prices.

    Option Three: Incentives are provided by the municipality to offset some or all of the additional burden placed on the project. This could come in the form of a density bonus, financial contribution, a waiving of other municipal charges/fees, and so on.

    Though I have questions about the details, this is something that was proposed in Ontario’s draft regulation (albeit not to the extent that the industry wanted). Now you know why I said and why I believe that these offsets are important to the industry and to overall housing affordability.

    My hope with this post was to provide the developer’s perspective, but also take a very matter of fact approach to inclusionary zoning. Most people recognize the importance of affordable and accessible housing. The question is how best to execute.

    Photo by Toa Heftiba on Unsplash

  • Inclusionary zoning is coming to Ontario

    On Monday the province of Ontario posted a draft regulation intended to establish a framework for inclusionary zoning. It builds on a bill that passed last year allowing municipalities – should they choose – to require affordable housing in new developments and redevelopments.

    Below are some, but not all, of the things that are being considered in the draft regulation. Some of these items were recommendations made by the development industry through the Ontario Home Builders’ Association (OHBA) and the Building Industry and Land Development Association (BILD).

    – The total number of affordable units or gross floor area dedicated to affordable housing units would not exceed 5% of the total units or 5% of the total gross floor area (excluding common areas). This number increase to 10% in high density transit station areas.

    – The affordable period would be a minimum of 20 years but no greater than 30 years.

    – There may be opportunities to provide the inclusionary zoning units off-site.

    – The policies would only apply to developments / redevelopments with 20 or more units.

    – The affordable component could not be used to determine community benefits under Section 37. Section 37 would also not apply if the proposed development (with IZ) is in a location where a development / community planning permit is used.

    – Municipalities would be required to offer incentives to help offset the IZ cost burden, but only if the development is not subject to a development / community planning permit. The incentives could include a waiver or reduction in application fees, parkland dedication fees, development charges, and so on. These offsets are very important to the industry and the affordability of the market rate units. But interestingly enough, increases in height and/or density are not being contemplated as a possible incentive or financial contribution.

    – The financial contribution would be based on the following formula: (A – B) x 0.4. A is the total sum of the average market price for all of the affordable housing units and B is the total sum of the affordable price for all of the IZ housing units. In other words, the intent is that municipalities would be required to offset 40% of the costs associated with providing the affordable units.

    Click here for the rest of the draft regulation. The OHBA also published this media release following the draft. They like the “partnership model” but were advocating for a 50/50 public/private cost share on all government-mandated units.

    If you’re looking for more reading on inclusionary zoning, check here, here, and here.

    Photo by Omair Khan on Unsplash

  • What land-use restrictions are doing to our cities

    I have Richard Florida’s recent book, The New Urban Crisis, sitting on my bedside table. I’m only about ¼ of the way through it, but I’m really enjoying it. I’ll write more once I’m done.

    What I instead want to talk about today is a recent (and related) article that Florida published in CityLab called: Did Land-Use Restrictions Save the Rust Belt? 

    In it, he leans on the research of two economists – Chang-Tai Hsieh of the University of Chicago and Enrico Moretti of the University of California at Berkeley – and makes 3 valuable points.

    They are:

    It is estimated that land-use restrictions (which limit development / supply) have reduced overall GDP in the U.S. by about 9% or approximately $1.5 trillion per year. It is also estimated that housing supply constraints alone lowered overall growth by more than half between 1964 and 2009.

    At the same time, these land-use restrictions may have benefited other regions – such as the Rust Belt – that would have otherwise lost more people and jobs to places like New York and San Francisco. The research found that without these land-use restrictions, employment growth between 1964 and 2009 would have been more than 1,000% higher in New York and almost 700% higher in San Francisco.

    The final takeaway is one that we’ve talked about before on this blog. One of the most effective things we can do to counteract geographic inequality is to build great transit; transit that connects both people and land to the most desirable areas of our city.

    And with that, Happy Canada Day weekend all.

    Photo by João Silas on Unsplash

  • Operating at the margins

    image

    I’ve been thinking about land markets as of late and so today I thought I would share a post by Toby Lloyd that I recently discovered called: Understanding and adapting the land market is key to solving our housing crisis (2014). It’s from the London School of Economics’ British Politics and Policy blog.

    His argument, as the title suggests, is that we need to dig deeper and look at how our land markets are functioning if we want to address some of the challenges facing our cities today.

    The post is obviously written from a UK perspective, but many of his points will probably ring true for a lot of you in the industry. One remark that stood out for me was his point about developers always operating at the margins:

    “The result of the land auction process is that the worst scheme, the one that offers the least to the community, the poorest quality homes, and charges the most for them, is generally the one that will happen, because this is the one that offers the most cash up front to the landowner. As a result, development is always already at the margins of viability. Even a relatively small shock can see construction grind to a halt rapidly, because there is simply not enough margin left after the landowner’s cut has come out for the developer to want to build.”

    When it comes to building, most people tend to think about the developer, the architect, and so on. But what I think many people overlook is that this entire process starts with a land input and a landowner. And the cost, availability and usability of that land input has a significant impact on everything that happens downstream.

  • Thoughts on inclusionary zoning

    Ontario is looking to pass legislation that would allow municipalities in the province to implement something known as inclusionary zoning. If passed and should municipalities decide to use this tool (Toronto almost certainly would), developers would then be required and/or incentivized to include some percentage of affordable housing in their new market rate developments. 

    Politically, inclusionary zoning tends to be popular. It’s believed to be a way for governments to create new affordable housing using relatively small public subsidies. Not surprisingly though, the development industry generally hates IZ. It’s another cost that needs to be added to the development pro forma – though some municipalities rightly offset these additional costs with additional density, breaks on levies, and so on.

    What I always think about when this topic comes up is the broader economic impact of the land use policy. Because I’m suspect that it’s as simple as: mandate affordable housing; get more affordable housing for free. Generally there are always trade-offs.

    So here’s some reading material for you all this morning.

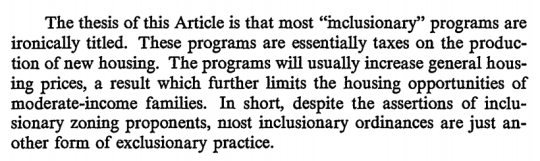
    In a classic paper (1981) by Yale Professor Robert C. Ellickson – called The Irony of Inclusionary Zoning – he argues that these practices can actually increase general house prices:

    image

    As a counterargument Owen Pickford over at The Urbanist argues that IZ simply reduces land prices as a result of the new tax. Land, after all, is the residual claimant. Therefore, he believes it’s an effective affordable housing policy. (I’m not so sure I believe that land prices would decrease in practice.)

    There’s also debate about the effectiveness of inclusionary zoning to actually deliver affordable housing at a meaningful scale. City Observatory wrote a post that looked at the total number of units produced (through IZ) across a number of American cities and the results were spotty. It should, however, be noted that not all inclusionary zoning policies are mandatory.

    Finally, the Furman Center for Real Estate & Urban Policy at New York University published a housing policy brief back in 2008 that looked at this exact topic. While they admit that the data is scarce, they come to the conclusion that IZ had no meaningful impact on the prices and production of single-family housing in San Francisco, but that IZ seems to have slightly decreased production and slightly increased pricing in the suburbs of Boston.

    What this last point suggests is that inclusionary zoning policies are not all created equal. So like all difficult questions, the answer to this one is likely: it depends. If anyone can point me to better data on inclusionary zoning, I would love to see it.

  • Easier said than done

    Earlier this week I saw the Chief Planner of Toronto, Jennifer Keesmaat, tweet this out:

    //platform.twitter.com/widgets.js

    I responded with the below quote retweet because I figured I should probably devote a blog post to this topic and not just a tweet.

    //platform.twitter.com/widgets.js

    Now, I don’t know for sure, but I am guessing that her tweet was in response to the criticism from architects and developers that Toronto’s design guidelines are creating homogenous architectural outcomes. Some people – and I’ve written about this before on ATC – believe they’re too prescriptive.

    So today I’d like to talk about why playing creatively within the guidelines/zoning envelope, particularly at the mid-rise scale, is a lot easier said than done.

    Generally speaking, the value of land is dependent on what you can do with it or, in this case, what you can build on it.

    If all you could do was plant things on it, then the value of the land would be correlated with crop yields. If on the other hand you could build a building, it would be correlated, at least in theory, with the amount of space you could build and the rents you could charge for that space.

    Of course, this isn’t a perfect science. That’s why I said “in theory.”

    Landowners obviously want to maximize the value of their asset when it comes time to sell. So they, along with their brokers, will naturally try and stretch what is possible with the land. Why else do you think the best neighborhoods seem to magically grow new boundaries?

    When you combine this with the fact that mid-rise buildings are inherently less efficient to build and with the fact that their smaller size creates diseconomies of scale, it can be exceptionally difficult to find development sites where the numbers make any sort of financial sense. That is, even if you “maximize the envelope” and push rents or sale prices.

    So, with all due respect, not maximizing the envelope is almost unthinkable, unless you somehow managed to get a bargain on the land.

    Many of you will likely respond in the comments saying that all of this is simply a result of real estate developers being greedy capitalist pigs. But what we are talking about is no different than in any other competitive business environment. 

    Developers rent and sell products – albeit products that take an incredibly long time to make and bring to market. To make those products, there are a many costs, ranging from the cost of land to the cost of drawings. But hopefully within all of those numbers sits a profit margin that makes sense given the amount of work and risk that the developer has taken on. 

    Put differently, telling developers not to maximize the envelope is like telling a pizza maker to throw out 10-15% of her dough before she makes every pizza – even though she already (over)paid in full for the dough.

    If you’ve ever created a development pro forma, you’ll know that it’s not easy getting the numbers to work when you’re operating in a competitive market. This is not a knock against creative design. Trust me, I am a design snob. This is just business.

  • A breakdown of land use in Vancouver

    Last night when I was thumbing through Twitter before bed, I came across this blog post describing Vancouver’s land use types. The blog itself is called Mountain Doodles, but it’s not exactly clear who the author is. 

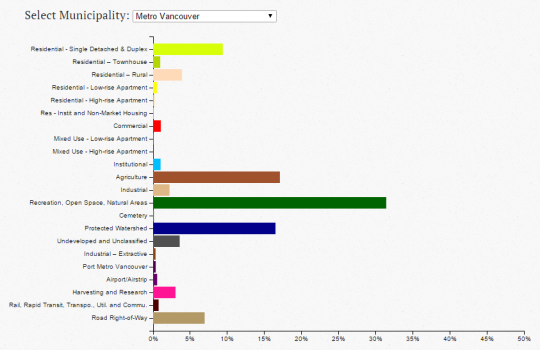
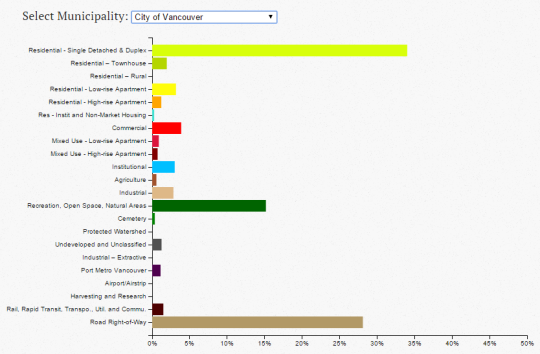
    In any event, what she/he did was analyze Vancouver’s land use dataset to come up with a series of charts that break down the percentage of each type: residential single detached, residential low-rise apartment, commercial, green space, and so on.

    Here’s what the chart looks like for Metro Vancouver:

    And here’s what it looks like for just the City of Vancouver, proper:

    When you look at the metro area, green / open space dominates. Although, the author states that, given the dataset, there could be a small overstatement of green space. There’s also the question of where the overall boundary was drawn.

    When you look at only the City of Vancouver, it’s land for residential housing (detached and duplex) and roads that dominate, with green / open space coming in a somewhat distant third.

    Of course, this does not speak to the intensity in which any of the above land might be used, such as the apartment lands (i.e., the third dimension). But from a two-dimensional perspective, you certainly get a sense of what we – for better or for worse – have chosen to privilege.