Daily insights for city builders, delivered every morning at 6 AM ET. I’m Brandon Donnelly — a Toronto-based real estate developer and founder of Globizen. I’ve been writing here since 2013.

Tag: index

  • Miami is the top US city for foreign businesses

    The Financial Times and Nikkei have just published their inaugural Investing in America report, which looks at the best US cities for foreign multinationals to invest in and do business in.

    To come up with this, they used about three dozen different metrics — everything from openness to quality of life. From what I can tell though, it doesn’t appear that climate risk factored much into this ranking. It should.

    There’s a lot of Florida on this list and Miami comes out on top, largely because, last year, it had the most foreign direct investment per capita of any US city. It also has a well-connected airport, two of the largest shipping ports in the US, and an international population.

    Lots of people and companies are going long Miami right now.

  • America’s return to the office

    Envoy, which is a workplace platform that offers products such as these, recently used its data to publish a kind of return to work index. More specifically, they used millions of anonymized employee and visitor sign-ins from their platforms to figure out who was returning to the office. Their dataset covers over 14,000 locations and all 50 states. And what they found was what you see at the top of this post, which is a look at workplace foot traffic in the top 10 US metropolitan areas compared to a May 2020 baseline. On average, traffic is up over 200%. And for some metropolitan areas, like the Philadelphia metro, it is up over 360%. There was a blip around January, but I think the trendline here is pretty clear.

    For more on Envoy’s return to work index, click here.

  • Latest house-price indicators from The Economist

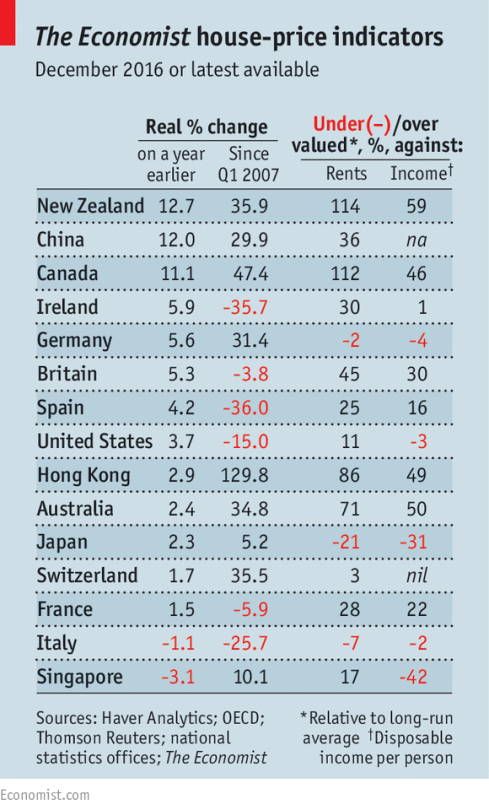
    The Economist recently published the following chart alongside this article talking about the impact of foreign buyers on global house prices.

    image

    They also have this set of interactive graphs that allows you to chart prices according to a number of different measures. The two metrics that The Economist focuses on (above) are house prices against rents and house prices against incomes. 

    The argument they make is that as (foreign) capital begins to think of property as merely a bolthole, it can start to detach itself from fundamentals such as rents and incomes. New Zealand, Canada, and Australia are specifically called out.

    This isn’t necessarily news. And one chart can only tell you so much. But I like staying on top of the various indices.

  • The Storefront Index

    The folks over at City Observatory have recently developed something called The Storefront Index

    It is a mapping of “clustered” consumer-facing storefront businesses across the 51 largest cities in the United States and within a 3-mile radius of their CBD. (Their definition of cluster is that the business is located within 100m of another business.)

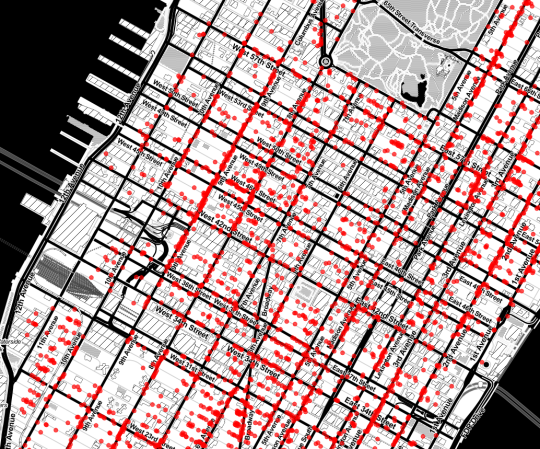
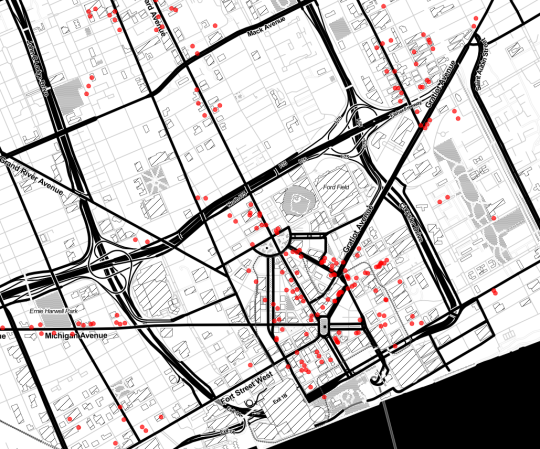
    At the top of this list is New York (no surprise here) with 9,905 storefronts and at the bottom of this list is Detroit (probably no surprise here either) with 411 storefronts. On average, they found that the “typical” city has about 900 storefronts within this 3-mile radius.

    Here’s a screenshot of New York:

    image

    And here’s a screenshot of Detroit:

    image

    They should be at the same scale.

    If you’d like to read their Storefront Index Report, you can do that here. And if you’d like to explore their interactive maps, you can do that here. City Observatory has made all of this available as a free tool for city builders – which is really great to see. (You can even download their shapefiles if you’re into that sort of thing.)