Daily insights for city builders, delivered every morning at 6 AM ET. I’m Brandon Donnelly — a Toronto-based real estate developer and founder of Globizen. I’ve been writing here since 2013.

Tag: housing

  • The real reason we want entertaining spaces

    According to a recent study out of UCLA, which I discovered via this Curbed article, American families tend to spend most of their time at home in informal, rather than formal, spaces. That means more time in the kitchen and family room, as opposed to in the living room and formal dining room. 

    I’m sure this comes as no surprise to all of you. Was a study necessary? Maybe you even have plastic on the furniture in your formal rooms because, you know, they’re reserved for “entertaining.” The reason I mention this is because I thought it was funny how Kate Wagner describes this phenomenon in her Curbed article:

    The ironic inefficiency of hyper-exaggerated high-end entertaining spaces belies a truth: These spaces aren’t really designed for entertaining. They’re designed for impressing others. And not just impressing others: After all, it’s general politeness to compliment a host on their home no matter how impressive it is. The real goal, deeply embedded in these oversized, over-elaborate houses, is not for guests to say, “Oh wow, this is nice,” but to make them think, “Oh wow, this is nicer than what I have and now I feel jealous and insecure.” In true American irony, these giant “social” spaces (and McMansions in general) are birthed from a deeply antisocial sentiment: making others feel small. Considering that so often our guests are members of our own family adds another layer of darkness to the equation.

    For those of you who aren’t familiar with Kate Wagner, she is the founder of McMansion Hell, which is a hilarious website dedicated to blasting McMansions. A pejorative term for houses that privilege raw size and the appearance of wealth over quality. Now that you know that, I am sure the above blurb makes a lot of sense.
  • The most expensive parking spot in the world

    I saw in the news recently that Hong Kong just set a new world record for the most expensive parking spot. I think it also held the previous record.

    Last month somebody paid HKD 6 million for a single stall in the Ultima apartment complex in Kowloon. That’s about USD 765,000 or CAD 1 million based on today’s rates. And the spot is 16.4 feet x 8.2 feet, so that works out to about CAD 7,436 per square foot. 

    What is clear is that supply is not keeping up with demand. Here is the stat from a recent Toronto Star article:

    The number of parking spaces grew just 9.5 per cent to 743,000 from 2006 through 2016 [in Hong Kong], while the private car population surged 49 per cent to 536,025, according to a report by the city’s Transport Department.

    There are a number market forces which are undoubtedly bringing down the ratio of parking stalls to housing units. That same phenomenon is also pretty clear here in Toronto. But it is interesting to note the continued growth in private cars.

  • How large metro areas are driving the global economy

    “The concentration of economic growth and prosperity in large metro areas defines the modern global economy, creating both opportunities and challenges in an era in which national political, economic, and societal trends are increasingly influenced by subnational dynamics.” -Brookings Institute

    The Metropolitan Policy Program at the Brookings Institute has a new report out for 2018 called the Global Metro Monitor.

    Here are some of the highlights (data is from 2014 to 2016):

    – The 300 largest metro areas in the world accounted for 36% of employment growth and 67% of GDP growth.

    – Metro areas in China and the Asia-Pacific region outperformed, whereas Latin American cities, and in particular the largest Brazilian cities, were weaker performers.

    – The majority of large metro areas had growth rates that exceeded that of their respective regions. So again, cities are the driver.

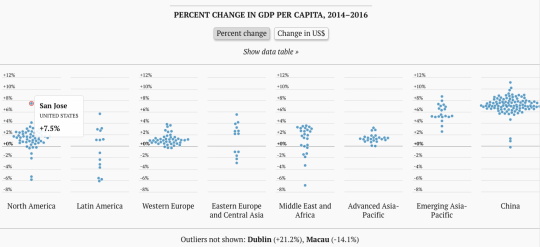
    And here is an interesting interactive chart (better to click through) that shows the % change in GDP per capita. 

    image

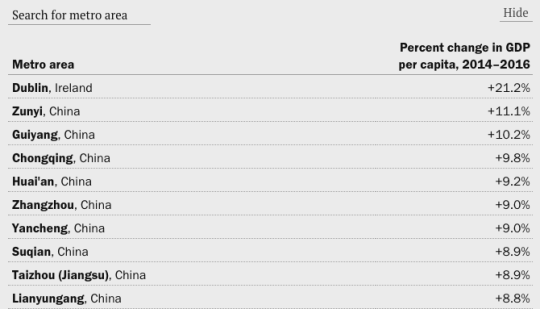
    Look at how much of an outlier San Jose is. Though, check out Dublin in the footnote. And if you look at the actual data table, it is all China, except for Dublin at the top.

    image

    For the rest of the charts, click here. And to download the full Global Metro Monitor report, click here.

  • Hypervacancy in America’s legacy cities

    I was reading Aaron Renn’s post this morning on America’s vacant housing challenge and I was reminded of the stark contrast between what we are experiencing here in Toronto and what the US is experiencing in a lot of its coastal cities, compared to what is happening in many legacy cities in the US. The former industrial centers. In this latter case, the discussion is around neighborhoods reaching a tipping point in terms of vacant homes and then spiralling out of control. Below is an excerpt from a study that Renn cites in his post. It is from the Lincoln Institute of Land Policy and it’s called “The Empty House Next Door.” The above chart should also tell you a lot about the magnitude of this problem.

    Hypervacancy has been rising steadily in legacy cities since the 1990s. Although only one out of sixteen census tracts in Cleveland was hypervacant in 1990, by 2010, one out of two tracts in that city had reached hypervacancy. When vacancies rise above approximately 20 percent of an area’s total properties, the number of vacant buildings and lots may continue to grow indefinitely. Although vacancies rarely reach 100 percent—because even the most distressed neighbor- hood may have a few long-term owners—the market effectively ceases to function. Houses sell, if they sell at all, only to investors at rock bottom prices while the neighborhoods become areas of concentrated poverty, unemployment, and health problems.

  • More on One Delisle and the block

    image

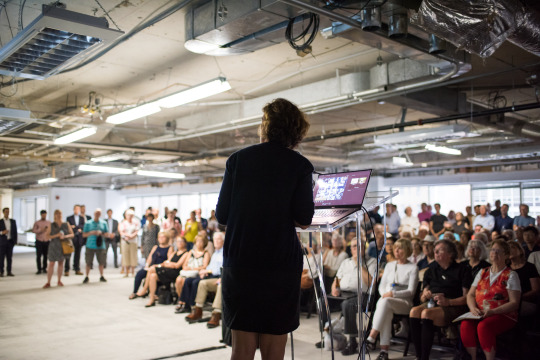
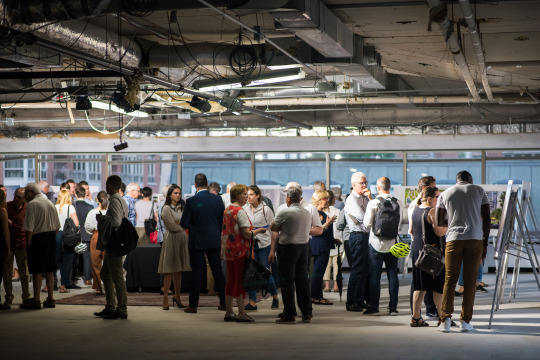
    Now that things have quieted down from last night, I would like to say that we are thrilled by the response to One Delisle and the broader ideas for the block. There was a lot of positivity last night at the open house and today the project team received countless emails and messages from people telling us that they are excited and/or looking forward to working with us over the coming years. Many were from the local community.

    image

    Following yesterday’s Globe and Mail piece by Alex Bozikovic, One Delisle was also covered in Urban Toronto (read the comments), designboom (they’re allergic to capital letters), ArchDaily, Canadian Architect, Dezeen, The Architect’s Newspaper, and probably other places that I am missing. The comments have been interesting to read and there seems to be a fatigue around boring glass boxes. This project team does not want to do that.

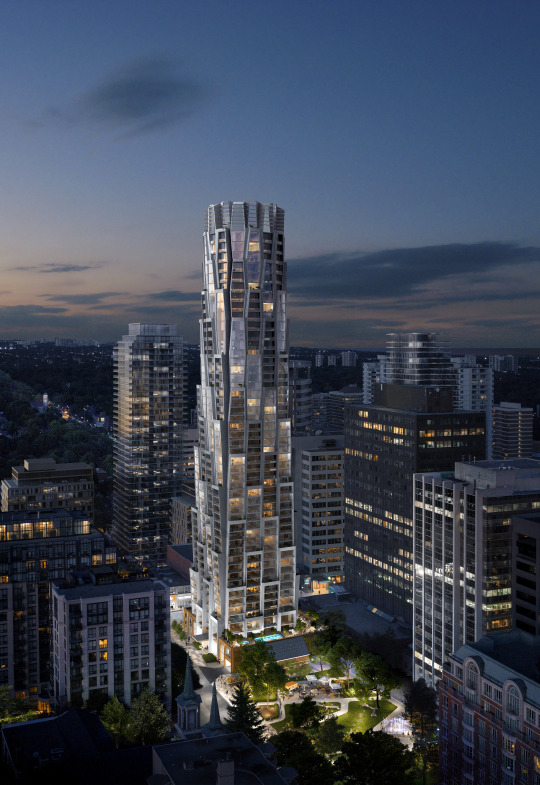
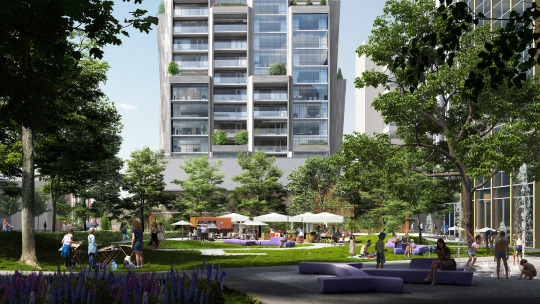
    Though the project has been making the rounds, there are two images that I don’t think have been widely shared and so I would like to do that today (below). Both were presented at last night’s open house. And they are intended to show the relationship between One Delisle and Delisle Park, which is proposed to be revitalized and expanded by ~50% as part of the project’s block and enhanced public realm strategy. Credit to ADHOC Studio for these renderings.

    imageimage

    In fact, it is important to keep in mind that while a lot of attention is being paid to the architecture of the building, there’s a broader city building strategy that is attached and integral to it:

    • Revitalize and expand Delisle Park by 50%
    • Add residential uses to a block of office buildings
    • Reduce the number of vehicular access points across the block from 5 to 3 in order to improve traffic flows in the area
    • Create below-grade vehicular connections across the block to consolidate and legitimize access/loading and once again improve traffic flows in the area 
    • Significantly widen the sidewalk along Yonge Street to eliminate existing pedestrian pinch point
    • Significantly widen the sidewalk along Delisle Avenue to strengthen connection to Delisle Park
    • Introduce pedestrian laneway with art canopy to connect St. Clair Avenue West back to Delisle Park
    • Create a unified and consistent public realm across the block and provide retail animation along its edges
    • Retain Art Deco facade along Yonge Street
    • Target the 2nd tier of the Toronto Green Standard (voluntary sustainability target)
    • Continue to explore the feasibility of district energy solutions across the block to take advantage of the different energy demand curves for office, retail, and residential uses

    Once again, a big thanks to the ~300 people who came out last night – in the rain – to engage with the project team. And a big thanks to the full project team who worked tirelessly to prepare for this week’s community open house. But as was said on Thursday night, in many ways this is really just the beginning. To stay informed about the project and to provide your feedback to the team, stay tuned to yongedelisle.ca.

    Photos: Khristel Studios

  • Airbnb and affordable housing

    image

    Fred Wilson published a good post last weekend on the proposed bill that went to New York City Council this week regarding new reporting requirements for Airbnb and their hosts in NYC. You can read more about his position on his blog, but he is in favor of a comprehensive bill that would properly legitimize short-term rentals. He is also not opposed to city and state taxes on the service.

    What I wanted to focus on today were his comments around housing. This is already sounding like a broken record, but Fred draws attention to the severe supply-demand imbalance that is occurring in the boroughs of Brooklyn, Queens, and the Bronx, precisely because many/most young people were priced out of Manhattan long ago and want to live in these places.

    But I particularly like his comments around what makes for good policy and what makes for good politics. I agree with his view that it is often a case of the latter over the former. I think a lot of the excitement around Airbnb is a red herring. For me, it’s akin to the fixation on foreign buyers and their impact on the local housing market in places like Toronto and Vancouver.

    Yes, they are factors. But the data suggests they are marginal ones. As Fred points out, they are almost certainly not the root cause of the problem. The reality is that we need a lot more housing – both market-rate housing and subsidized housing. The challenge is that nobody wants to pay for the latter and so we’ve instead decided to focus on things that sound like they’re going to help.

    Photo by Jon Tyson on Unsplash

  • Vancouver revisits laneway house program

    Vancouver is light years ahead of Toronto when it comes to laneway housing/suites. And by light years I mean that their Laneway House (LWH) Program is about a decade old now.

    Last month the City of Vancouver published this staff report which outlined recommendations for improving the program. It includes simplifying the regulations, reducing processing timelines, and improving livability in LWHs.

    This aligns with their Housing Vancouver Strategy (2018-2027), which has set a target of 4,000 new LWHs over the coming ten years. That may not seem like a lot and certainly it won’t solve everything, but I reckon that 4,000 is better than 0.

    The city also estimates that approximately 50% of these new LWHs will be two and three bedroom homes, which makes them a viable housing solution for families who want to remain in the city. (Related post: Where are all the kids?)

    There’s a lot of good stuff in the staff report if you’re so inclined, but I’ll leave you with a few facts about the current LWH program in Vancouver. 90% of LWHs are built along with a new house. And 45% of all new houses, so almost half, are now built with a LWH.

    Only 10% of LWHs are single storey, which certainly helps to support the above percentage of two and three bedroom homes. And in both 2016 and 2017 over 500 building permits for LWHs were issued each year.

    So 4,000 LWHs over the next decade may actually be a fairly conservative estimate. Thank you to Michael Geller for sending me this staff report.

    Photo by Spencer Watson on Unsplash

  • Where are all the kids?

    This evening, when I was reading the internet, I came across this New York Times article from 2017 talking about how San Francisco has the lowest percentage of children of any of the largest cities in the U.S. It’s around 13% of the population. (Supposedly it was the second lowest in 2015. Pittsburgh was first.)

    The article goes on to claim that the city has approximately the same number of dogs as it does children. That number is somewhere around 120,000. Not surprisingly, many blame the city’s prohibitive housing costs as the main culprit for the lack of kids. Families simply cannot afford to live in the city.

    This got me searching for more information. Richard Florida looked at similar data back in 2015, but it’s important to note that he looked at metro areas and not the city propers. So the data doesn’t speak to whether families were forced to move out from the urban core to the suburbs in search of more affordable housing or for more space.

    Nevertheless, he finds no statistical association between the share of children in a city and things like urban density, economic output per capita, or median home prices. He instead finds that the share of children is positively correlated with two main factors: immigration and with ethnicity – specifically people of Latin origin.

    Click here if you’d like to read the rest of Florida’s analysis. And if any of you have additional data on this topic, please do share it below. I think I’m going to continue digging into this question of kids and cities.

    Image: Photo by William Bout on Unsplash

  • An example of city building doublethink

    Earlier this month, Shane Dingman wrote a piece in the Globe and Mail talking about TAS’ proposed development for 2 Tecumseth Avenue here in Toronto – the former home of Quality Meat Packers, a slaughterhouse. In the article there’s a quote from Mazyar Mortazavi, which I posted to my Instagram (as a story), but that I have been meaning to also post to the blog. So here it is: 

    “It’s not a conversation about towers good, towers bad: Mid-rise is the most expensive construction typology and it delivers effectively luxury housing, so it doesn’t respond to the needs of affordability,” he said. “We didn’t buy Tecumseth to build a bunch of condos and move on. We bought it because we wanted to pursue a vision around city building. You need density … the question is how do we actually deliver density that’s relevant today and relevant 50 years from now?”

    He’s of course right about mid-rise construction costs. There are diseconomies of scale and other construction inefficiencies that we have talked about many times before on this blog. The result is one of the Catch-22s of city building. Mid-rise and small scale infill is often seen as desirable, but we also say that we need more affordable housing.

    It’s doublethink.

    Image: 2 Tecumseth by KPMB Architects for TAS

  • DANCHI DREAMS

    Below is an interesting Kickstarter project by photographer and art director Cody Ellingham. I think many of you will appreciate it. It is a photobook of Japanese public housing apartments, which are known as Danchi. All of the photos were taken by Cory at night, hence the dream part. The book is about the promise that these projects represented in the post-war years, but it is also about their decline in the subsequent decades.

    https://www.kickstarter.com/projects/cbje/danchi-dreams-a-photobook-of-japanese-public-housi/widget/video.html