Daily insights for city builders, delivered every morning at 6 AM ET. I’m Brandon Donnelly — a Toronto-based real estate developer and founder of Globizen. I’ve been writing here since 2013.

Tag: housing data

  • Some 60,000 condominium units were purchased last year in Toronto

    So 2021 was a pretty good year for condominiums here in the Greater Toronto Area. According to the latest data (Q4-2021) from Urbanation, this is what happened last year:

    • 30,844 new condominium sales. This is a 69% increase compared to 2020, which saw 18,282 new unit sales.
    • Fourth quarter alone saw 8,361 unit sales, which is the best quarter on record according to Urbanation.
    • Unsold inventory dropped 26% year-over-year because sales exceeded the number of new project launches by over 4,000 units.
    • Average price for an unsold condominium unit in Q4-2021 reached $1,322 psf, which is an 18% increase compared to the year before.
    • Resale condominiums also did exceptionally well with 29,880 unit sales — a 49% annual increase.
    • All in all, some 60,000 condominium units were purchased last year in the GTA. Of course, some were ready to be lived in and some were future homes.
  • Average price of a home in the Toronto region increased 13.5% last year

    The Toronto Regional Real Estate Board released its 2020 housing figures this week. And I suspect that the numbers are probably directionally similar for many city regions around the world.

    2020 saw more home sales than 2019 with 95,151 homes changing hands. This represents an 8.4% increase compared to last year. December was also a record month with 7,180 sales — a 65% year-over-year increase!

    The average selling price in the Greater Toronto Area also reached a new record of $929,699. This represents a 13.5% increase compared to last year. Once again, December was a record setting month with an average selling price of $932,222.

    When you look at sales and average prices by home type, the biggest drivers were low-rise homes outside of the city. No surprises here.

    But consider the price spread that now exists between condos and detached homes. In the City of Toronto (“416”), we’re talking about an average price delta of nearly $850k. That would be an expensive home in many other markets.

    Of course, condos tend to be smaller than detached homes. And so different prices per pound. But total price matters a great deal and historically a widening spread has moved many buyers over to the condo market.

    I suspect we will see that happen again this year.

  • Percentage of young Americans now living with a parent

    Here’s some data from the Pew Research Center looking at the percentage of young people (18- to 29-year olds) in the US that live with at least one parent. It it based on an analysis of monthly Census Bureau data and is obviously interesting/relevant given that this pandemic seems to have precipitated a number of people moving back home. As of July of this year, 52% of young adults were thought to be living with at least one parent, which is up from 47% back in February.

    At first I was surprised to see these numbers as high as they are. But it’s really the 18-24 age bracket that is driving this number up, which makes sense given that a chunk of this demographic is probably in school, not working, and now unable to do much on a campus. Among 25- to 29-year olds, the range is significantly lower, with just over a quarter (26% -> 28%) living with their parent(s).

    What I’m curious about now, after seeing this chart, is what is driving some of these regional, ethnic, and gender differences? Why are young midwesterners seemingly less likely to live with a parent compared to those in the northeast? Is it cultural? Economic? Or something else? And is the above an indication that maybe women are more independent than men?

  • New high-rise home prices up 39.5% year-over-year

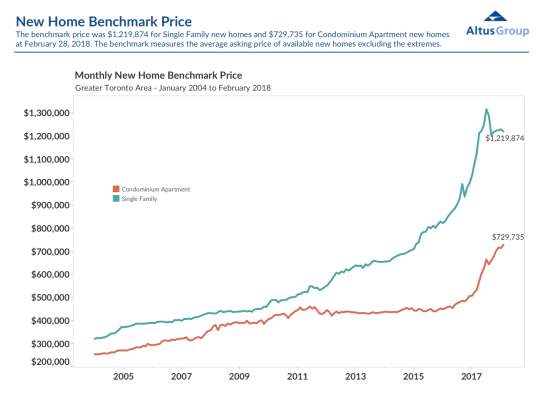
    February data (2018) for the new home market in the Greater Toronto Area was released this past week by BILD and Altus. I seem to have gotten into the habit of writing about this every month.

    The benchmark price for new low-rise single-family housing was down slightly from January to $1,219,874, but still up 12.8% from a year prior.

    The benchmark price for new high-rise housing was up a whopping 39.5% year-over-year to $729,735. But part of this is being driven by an equally dramatic increase in average unit sizes.

    Here is the relevant graph:

    image

    The story continues to be about tight supply, historically low developer inventories, and a lack of affordable low-rise product. 

    As I have argued many times before on this blog, I believe these factors — and in particular the last one — are, at least partly, driving this recent pop in high-rise pricing. People are priced out and now searching for substitutes.

    So my prediction continues to be that we will see a convergence (i.e. diminishing spread) between new low-rise and high-rise pricing.

    That will also bring about design and product changes on the high-rise side.

  • Federal court upholds decision that TREB’s housing sales data should be available online

    The Toronto Real Estate Board (Canada’s largest real estate board) and the Competition Bureau have been fighting for years over whether TREB’s housing market sales data, including realtor commissions, should be publicly available online.

    The Competition Bureau, as well as many forward thinking realtors, believe that gatekeeping historical sales data is stifling competition and innovation. It is. But TREB has been arguing – for a number of years I might add – that it is genuinely concerned about consumer privacy.

    Well on Friday the Federal Court of Appeal ruled that TREB cannot prevent its members from freely publishing data about what properties have sold for. This is a positive, albeit a small, step forward for open data and innovation.

    But perhaps not surprisingly, TREB has already said it would appeal the decision to the Supreme Court of Canada and apply for an order staying the release of the above data until this new appeal gets decided.

    So there’s still more fighting to take place. Nevertheless, I do have a few thoughts.

    The claim by TREB that they are deeply concerned about consumer privacy is nonsense. Call up any realtor in this city and they’ll tell you and send you whatever historical sales data you want. This is about maintaining an information asymmetry that forces more consumers to connect with agents.

    But as many sensible realtors have already explained publicly in the media, if gatekeeping information is such a critical component of the value that TREB members bring to clients – and the board is certainly clinging to it – then realtors and/or the industry have a serious problem on their hands. 

    Time to evolve.

    I would also argue that our current archaic setup distorts the market. There’s simply too much friction associated with accessing good sales records and so the result is greater opacity in the market. Say all you want about the efficacy of realtors, more friction = less engagement. Free the data and empower members to leverage and build on top of it.

    In my view, this is a positive step forward. But it still feels like a small one. I’m actually surprised by how long this status-quo battle has been going on. Hopefully it gets wrapped up soon so everyone can get on with what matters most: innovating.

    Photo by Fernando Reyes on Unsplash

  • The answer to San Francisco’s housing affordability problem

    Blogger and programmer Eric Fischer has an excellent post up on his site where he looks at: “Employment, construction, and the cost of San Francisco apartments.” It’s worth a good solid read.

    What he did was dig deep into whatever data he could find – the data goes back to the beginning of the 20th century in some cases – to try and figure out a solution to San Francisco’s housing affordability problem.

    Many (including myself) have argued that, at least part of the solution, is to build more, not less, housing. However, others, such as Tim Redmond of 48 Hills, have argued that building more market-rate housing would simply exacerbate the current situation.

    In Eric’s analysis, he looked at everything from median rents and new housing units constructed (above graph) to annual wage growth and income inequality. I particularly liked his summary of the city’s various building booms. 

    In the end, here’s the conclusion that he came to:

    “In the long run, San Francisco’s CPI-adjusted average income is growing by 1.72% per year, and the number of employed people is growing by 0.326% per year, which together (if you believe the first model) will raise CPI-adjusted housing costs by 3.8% per year. Therefore, if price stability is the goal, the city and its citizens should try to increase the housing supply by an average of 1.5% per year (which is about 3.75 times the general rate since 1975, and with the current inventory would mean 5700 units per year). If visual stability is the goal instead, prices will probably continue to rise uncontrollably.”

    By visual stability, he is referring to maintaining the current urban fabric of San Francisco just the way it is. In other words, he is making the link between preservation and affordability in a prosperous and growing city.

    Intuitively, this makes sense to me. It’s unrealistic to think that you can maintaining some level of housing affordability without allowing supply to increase alongside demand.

    At the same time, I do not believe that preservation needs to equate to no changes whatsoever. Urban preservation, to me, should be about dutifully respecting the past while still looking firmly towards the future. And that’s how I believe successful should be approaching this problem.