Daily insights for city builders, delivered every morning at 6 AM ET. I’m Brandon Donnelly — a Toronto-based real estate developer and founder of Globizen. I’ve been writing here since 2013.

Tag: housing costs

  • Price of shelter increased 4.1% — or was it more?

    The latest US consumer price index report was recently published and for the 12-month period ending December 2021, the all items index rose 7.0%. This is the largest 12-month increase since June 1982. Here’s a breakdown:

    • Gasoline (all types): +49.6%
    • Used cars and truck: +37.3%
    • Meats/fish/poultry/eggs: +12.5%
    • New cars: +11.8%
    • Food at home: +6.5%
    • Electricity: +6.3%
    • Food away from home: +6.0%
    • Apparel: +5.8%
    • Transportation: +4.2%
    • Shelter: +4.1%

    The obvious standouts here are the price of gasoline and the price of used cars and trucks. Too much demand and not enough supply, it would seem. But the other conspicuous line item for me is shelter at only 4.1%. Is that it?

    As Charlie Bilello points out in his latest newsletter, US rents were estimated to be up about 17.8% in 2021 (the highest increase on record according to Apartment List) and the Case-Shiller US National Home Price Index was similarly up about 19% year-over-year.

    I also just glanced at the latest Urbanation rental report that came out today, and condominium rents were up 10.8% year-over-year here in the Greater Toronto Area. So I don’t know about this 4.1% number. But maybe I just missed something in the fine print.

  • Where are all the kids?

    This evening, when I was reading the internet, I came across this New York Times article from 2017 talking about how San Francisco has the lowest percentage of children of any of the largest cities in the U.S. It’s around 13% of the population. (Supposedly it was the second lowest in 2015. Pittsburgh was first.)

    The article goes on to claim that the city has approximately the same number of dogs as it does children. That number is somewhere around 120,000. Not surprisingly, many blame the city’s prohibitive housing costs as the main culprit for the lack of kids. Families simply cannot afford to live in the city.

    This got me searching for more information. Richard Florida looked at similar data back in 2015, but it’s important to note that he looked at metro areas and not the city propers. So the data doesn’t speak to whether families were forced to move out from the urban core to the suburbs in search of more affordable housing or for more space.

    Nevertheless, he finds no statistical association between the share of children in a city and things like urban density, economic output per capita, or median home prices. He instead finds that the share of children is positively correlated with two main factors: immigration and with ethnicity – specifically people of Latin origin.

    Click here if you’d like to read the rest of Florida’s analysis. And if any of you have additional data on this topic, please do share it below. I think I’m going to continue digging into this question of kids and cities.

    Image: Photo by William Bout on Unsplash

  • The rise of tech outposts

    What happens when wages and real estate prices become too high in a city? Companies start growing in lower cost locations. We’ve all seen this before. 

    Fred Wilson recently blogged about this “spillover effect”, citing a New York Times article talking about the growth of tech offices in Phoenix. As someone who sits on the board of many technology companies, he was noticing a thematic trend:

    “A big theme of board meetings I’ve been in over the past year is the crazy high cost of talent in the big tech centers (SF, NYC, LA, Boston, Seattle) and the need to grow headcount in lower cost locations.”

    We talk a lot about housing prices on this blog, and so I think it’s useful to see how this, along with high wages, also impacts companies. The two are interrelated.

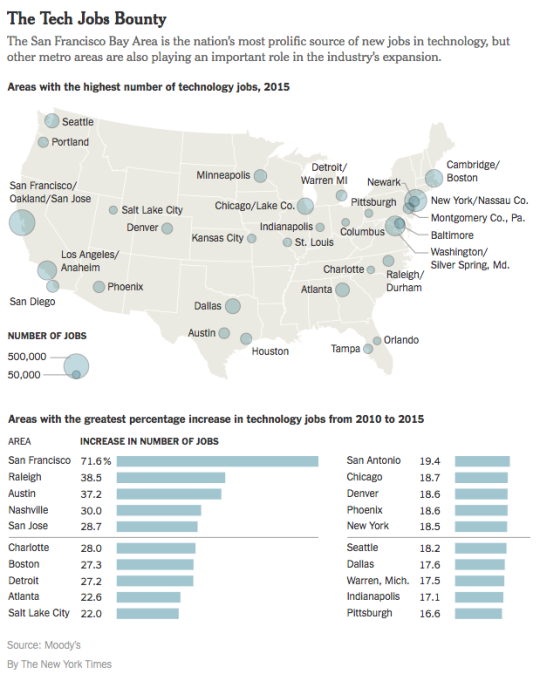
    Below is a chart from the NY Times article showing the US cities with the highest number of technology jobs and the most growth from 2010 to 2015. 

    San Francisco is in a league of its own. But overall, the growth is in tech and many cities are adding lots of technology jobs. Look at Detroit and Boston right beside each other (Detroit obviously has a smaller starting base). And look at how Miami is nowhere to be found.

    Of course, one interesting question is whether these new outposts – such as Phoenix – can truly come into their own and carve out a niche:

    “We don’t want to be San Francisco’s back office — we need more creators here,” said Scott Salkin, a founder and the chief executive of Allbound, which is based in Phoenix, makes sales software and has offices down the hall from Gainsight’s.

    Even with the high cost of living, it’s hard to supplant the coastal hegemony. That’s where people go to chase riches. As comedian Daniel Tosh likes to say, “the middle of the country is for people who gave up on their dreams.”

    Though for some, living in a place like Denver or Salt Lake City and snowboarding every weekend is a better outcome than living in a studio apartment and commuting an hour to work.

  • Are startups causing inequality?

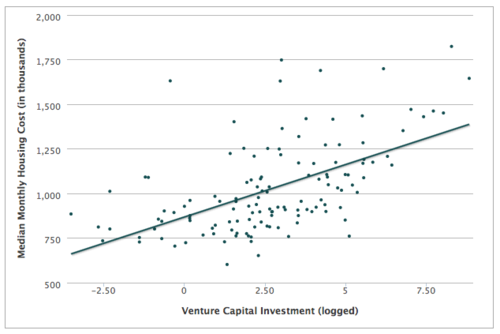
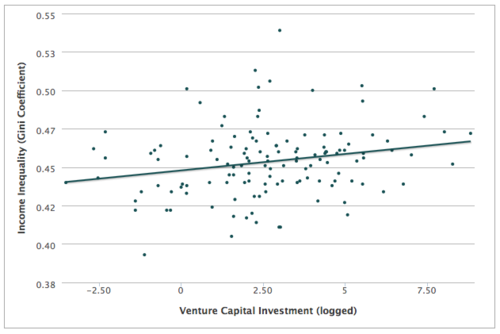
    Earlier this week Richard Florida published on article on CityLab talking about the relationship between tech innovation (in cities) and inequality. Specifically, the article deals with the correlation between venture capital investment and a variety of factors, such as monthly housing costs, wage and income inequality, and so on.

    The intent of the piece was to address the growing backlash against tech workers – in places like San Francisco – who have become the symbol for the growing gap between the rich and poor.

    The strongest correlation appears to exist between venture capital investment and housing costs. As the amount of venture capital goes up, so do housing costs – which probably shouldn’t surprise you. The rich start outbidding the poor for housing. Note: The two outlying dots at the top right, in the graph below, are Silicon Valley and San Francisco.

    image

    But when it comes to inequality, the relationship isn’t so clear. For wage inequality, there seems to be a relationship. But for the broader income inequality measure, the relationship is fairly weak. Here’s the graph:

    image

    So this is not as black and white as it might seem. Regardless, Florida ends the piece with the following statement (that I think is spot on):

    It’s time to stop pointing fingers and get on with the far more important task of harnessing the urban tech revolution to create a new urban middle class and a more inclusive urbanism—one in which many more workers and residents can participate, and one from which many more can benefit.

    The answer is not to stop innovating. That would be counterproductive. We should be be encouraging innovation, but at the same time figuring out how best to harness it for society as a whole.

    Tomorrow, I’ll touch a bit more on how we might go about doing that. I have a post planned that I think will tie in really nicely to this discussion. So stay tuned.

  • Are the suburbs really cheaper?

    image

    Smart Growth America released a report this month called Measuring Sprawl 2014. It’s an update to a report they did back in 2002 and it’s worth a read if you’re into urban planning. You can download it here

    The report looks at 221 metro areas in the US and develops a “sprawl index ranking.” The higher the number, the more compact the metro area. Not surprisingly, New York tops the list with San Francisco coming in second. But more interesting are the correlations they discovered. As you go up their sprawl index ranking (that is, as the cities become more compact), they found the following:

    • People have greater economic opportunity in compact and connected metro areas.
    • People spend less of their household income on the combined cost of housing and transportation in these areas.
    • People have a greater number of transportation options available to them.
    • And people in compact, connected metro areas tend to be safer, healthier and live longer than their peers in more sprawling metro areas.

    If you’re a follower of smart growth, then some of these will sound familiar. But they’re worth repeating and I’d like to focus on the second one for a minute (not to undermine the importance of living longer). Conventional wisdom dictates that as you sprawl out from the center of a city, the cost of housing drops. And indeed, that’s what they found. There’s a correlation between density and housing costs, and more compact cities generally have more expensive housing.

    However, they also found that the percentage of income spent on transportation is much less in compact metros:

    Each 10 percent increase in an index score was associated with a 3.5 percent decrease in transportation costs relative to income. For instance, households in the San Francisco, CA area (index score: 194.3) spend an average of 12.4 percent of their income on transportation. Households in the Tampa, FL metro area (index score: 98.5) spend an average of 21.5 percent of their income on transportation.

    But here’s where it gets interesting: they found that transportation costs dropped faster than housing costs increased as metro areas became more compact. Meaning if you consider both housing costs and transportation costs in aggregate, it’s actually cheaper to live in more compact areas. From what I can tell, they’re also only considering direct transportation costs and not indirect costs such as the time people waste sitting in traffic. 

    Either way, it’s something to consider the next time you’re thinking about where to live and how much you should be willing to spend on housing. That cheaper suburban home may not be as cheap as it seems.

    Photo by Aythami Perez on 500px