Daily insights for city builders, delivered every morning at 6 AM ET. I’m Brandon Donnelly — a Toronto-based real estate developer and founder of Globizen. I’ve been writing here since 2013.

Tag: growth

  • Boom babies (of China)

    A few years ago I wrote a post talking about “depression babies.” In it, I cited a research paper that looked at the impact of macroeconomic shocks on people’s willingness to take on financial risk in the future. The term “depression babies” stems from the Great Depression and how it is believed to have impacted risk taking, savings rates, and probably many other things.

    I was reminded of this when I read this recent article in the WSJ talking about how the Chinese have started spending — and taking on the debt — like Americans, particularly among Chinese under 30. It is the inverse of the depression baby phenomenon. In this case, it is arguably years of economic expansion leading to greater comfort around financial risk.

    Here are a couple of figures from the article:

    JPMorgan estimates China’s ratio of household debt to gross domestic product will climb to 61% by 2020. That’s up from 26% in 2010 and higher than current levels in Italy and Greece.

    The level in the U.S. is about 76%, after falling from 98% in 2006, according to the International Monetary Fund.

    By another measure—the ratio of household debt to disposable income—China appears to have already surpassed the U.S. Its ratio reached 117.2% in 2018, up from 42.7% in 2008, according to calculations by Lei Ning, a researcher at the Institute for Advanced Research at Shanghai University of Finance and Economics. The U.S. peaked at 135% in 2007 and dropped to 101% in 2018.

    Not surprisingly, the article goes on to talk about how this dramatic increase in household debt might be something to worry about. Maybe. I’m not an economist. But I do think this is designed to boost the Chinese growth machine and I do think it makes them less reliant on other countries — such as, maybe, the United States.

  • Shaping Cities in an Urban Age

    Shaping Cities in an Urban Age is the third book to come out of the London School of Economic’s Urban Age project. It was published last fall. The first two titles were, Living in the Endless City (2011) and The Endless City (2007).

    If you’re familiar with the first two publications, you’ll know that these books are heavily illustrated. Lots of maps, charts, and diagrams. So they make great coffee table books. But they’re also filled with insightful essays — this one has 37 of them.

    In this particular book the focus is on the following:

    “It identifies current trends that are making cities more fragmented, less equitable and environmentally more damaging, and argues powerfully for a more integrated social, environmental and spatial approach that can inform and inspire city-makers that are shaping an increasingly urban world.”

    I am sharing this with all of you today because I have always really enjoyed these books. They have a way of quickly putting things into perspective globally.

    Around 2.5 billion more people are expected to live in an urban agglomeration by 2050. And 90% of this growth is expected to happen in just two places: Asia and Africa. This is an unprecedented shift that will obviously create many challenges and many opportunities.

    This book is about that.

    Image: Phaidon

  • The next 15 megacities

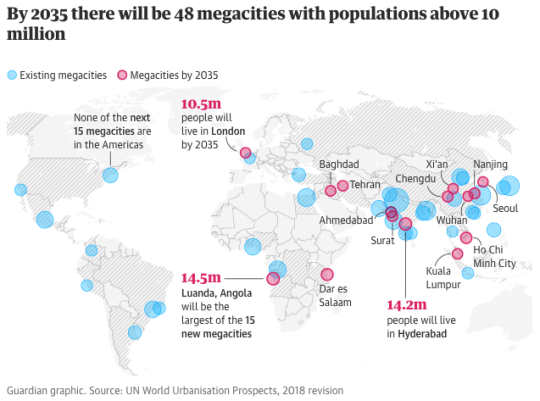
    The Guardian is running a series right now called: The next 15 megacities. A megacity is typically (but loosely) defined as a city (or metropolitan area) with a population of at least 10 million people. 

    By 2035, another 15 cities are expected to become megacities according to the United Nations. Hence the above series. None of these new entrants will be in the Americas. And only one – London – is anticipated to be in the West.

    The first city in their series is Baghdad. The second is Dar es Salaam. And the third, and latest, is Tehran. They are such interesting reads.

    I have said this before on the blog, but the pace of growth in many of these cities is astounding. Dar es Salaam – one of the fastest growing cities in the world – is adding about half a million people ever year.

    For the full megacities series, click here.

  • What to do about Hong Kong’s land supply problem?

    My friend Jeremiah shared this ULI article with me this morning, which talks about Hong Kong’s land supply problem. The interesting thing about this problem is that only 9.3 square miles of the city’s land (out of ~424 square miles) is actually developed (and about 60% of the region’s area is water). The rest has been preserved for parks, farmland, and so on. And that is certainly a remarkable characteristic of Hong Kong. It doesn’t take very long to escape its hyper-urbanism and be in the countryside.

    Preserving greenspace is of course vital. But at what point do population and growth pressures justify the unlocking of some of that land for development? This is the question that Hong Kong appears to be asking itself. At the same time, it is looking at developing other islands (such as Lantau, which I understand is a pretty lush place); reclaiming (i.e. creating) additional land; and positioning the city as part of a planned “Greater Bay Area.” 

    If it were up to you, how would you suggest that Hong Kong deal with these pressures? The city is already fairly adept at building up.

    Photo by Annie Spratt on Unsplash

  • Relationship between female literacy and total fertility rate

    This recent post by Sam Karam at NewGeography illustrates the relationship between female literacy and total fertility rates in Sub-Saharan Africa, India, and China. The overarching argument, which won’t surprise any of you, is that, “higher female literacy is a reliable predictor of lower fertility and improved prosperity.”

    The following graph uses data from populyst, the UN Population Division and UNESCO. The time period for the dataset varies by country but approximately corresponds to the latest 2000′s. All Sub-Saharan countries are represented, except for the Congo, Somolia, and South Sudan.

    image

    Noteworthy about this dataset is that the biggest decline in the total fertility rate happens precipitously after female literacy reaches and exceeds 80%. What is also interesting, but not surprising, if that the countries with the lowest gender equality rankings tend to also have high fertility rates. And that’s because low gender equality tends to translate into lower female literacy rates. 

    According to populyst, the above phenomenon – precipitous decline in TFR with rising female literacy – has already proved itself out in China. 

    Based on data from the World Bank, China’s total fertility rate dropped from 6.38 in 1966 to 2.75 in 1979. And since the one-child policy was only enacted in 1979, it doesn’t appear to be driven by that. (I would have initially expected some sort of surge in births prior to that policy.) From 1982 to 2000, the female literacy rate in China rose from 51% to 87%. Today it is 99.6%, which is basically the same as it is for males.

    For a more detailed look at the above data, check out this populyst post.

  • Fastest growing large cities in the US

    Last week the US Census Bureau released its 2017 population estimates for the largest cities in the country. All of the figures are for the city itself and not the broader MSA or some other boundary.

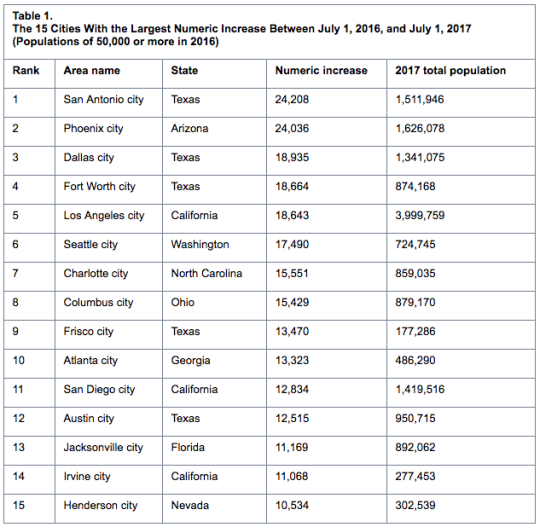
    Here are the top 15 cities with the largest numeric increases between July 1, 2016 and July 1, 2017:

    However, if we switch over to percentage increases, Frisco, Texas – which is part of the Dallas-Fort Worth metro area – jumps up to number one with an increase of 8.2%. 

    In fact, the top 3 cities (on percentage basis) are in Texas and 10 of the top 15 cities are located in the South. That shouldn’t come as a surprise to many of you. Related post: Follow the sun and sprawl.

    However, if we only consider the 25 largest cities in the US, the fastest growing city on a percentage basis was Seattle at 2.47%. Number two was Fort Worth at 2.18%. And number three was Charlotte at 1.84%.

    New York City sits at 0.08%. And Detroit lost people. But it’s not a horrible figure (-0.35%). For more tables and data, click here.

  • The 100 million city

    The Guardian recently published this reminder that the real population growth in the world today is happening in Asia and Africa. The article is called, “The 100 million city: is 21st century urbanisation out of control?” Much of the data is from this 2016 paper by Daniel Hoornweg and Kevin Pope, which projected the populations of the world’s biggest cities by 2100.

    The standout example is that of Lagos, Nigeria, which went from under 200,000 people in the 1960s to an estimated 20 million people today. Though, I would imagine that the ubiquity of informal settlements makes it difficult to come up with an accurate number.

    Still, it is one of the world’s top 10 largest cities and, by 2100, it may be the largest city in the world. The Guardian described the population as young, fertile, and increasingly urban. The median age in Nigeria is 18 and the fertility rate for the content is 4.4 births per woman.

    I am mentioning all of this today because I think it grants some perspective. This is an immense city building challenge, not only because of the unprecedented growth rate, but also because it remains largely poor. Lagos, a city, may add more than 2.2x the population of Canada, a country, during the balance of this century.

  • Five great surges of capital and technology, 1771-2017

    Carlota Perez is a professor that specializes in the social and economic impact of technological change. In 2002, she published an influential book called Technological Revolutions and Financial Capital: The Dynamics of Bubbles and Golden Ages.

    One of her arguments is that economic growth since the Industrial Revolution has occurred through a series of cycles and surges, ultimately culminating in a fifth great surge centered around information and telecommunications. This is our current economic environment.

    Perez was recently interviewed by strategy + business and they published this diagram (if it’s too small, click through to the article):

    The five surges of capital and technology since 1771 are:

    1. Industrial Revolution
    2. Steam and Railways
    3. Steel, Electricity, and Heavy Engineering
    4. Oil, Automobiles, and Mass Production 
    5. Information and Telecommunications

    Number 4 – oil, automobiles, and mass production – is what produced widespread suburbanization, a middle class filled with homeowners, and new forms of retail employment. And I am sure that most of you would agree that it’s not quite over yet.

    According to Perez, each cycle has two phases: an installation phase and a deployment phase. This latter phase is a “golden age.” But in between these two phases is a turning point that is typically characterized by some sort of crisis and recession. 

    Her belief is that we are in this turning point right now. You see it with Brexit. The demagogues being elected. And more. If you buy this, the key question naturally becomes: How do we cross this chasm and enter our next golden age?

    What’s also important to keep in mind about this theory is that it means that what we are seeing today, socio-economically, is not in fact new. We’ve been through this before. I’ll end with this quote from the interview with Perez:

    In the 1920s, wealth distribution looked the same as it does today. The top 1 percent received 25 percent of society’s total income. By the 1950s it was down to 10 percent. Every installation period brings inequality until the state comes back actively to reverse it and relieve social unrest.

    So what’s happening today may be temporary and it may be history repeating itself. If you’re interested in this topic, you can read the full interview here.

  • Follow the sun and sprawl

    image

    The U.S. Census Bureau recently released it’s 2016 city and town population estimates. The press release can be found here.

    The headline isn’t a new one. Southern cities continue to grow quickly. This is not a new trend. Humans seem to like warm weather and the housing supply in southern cities tends to be more elastic. This keeps home prices relatively in check and allows the cities to more easily accommodate growth.

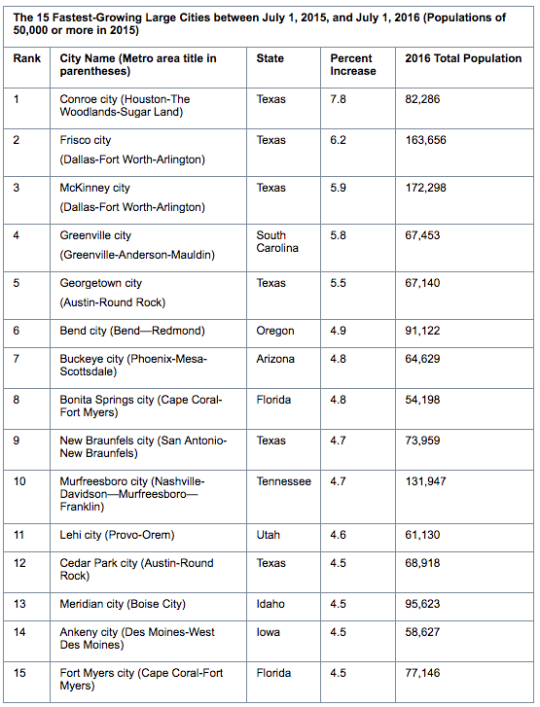
    From July 2015 to July 2016, 10 of the 15 fastest growing large U.S. cities were in the south (based on % growth). 4 of the top 5 were in Texas. 

    From 2010 to 2016, the population in large southern cities grew an average of 9.4%. Cities in the west clocked in at 7.3%. And cities in the northeast and midwest were at 1.8% and 3.0%, respectively.

    Two outliers near the top are Seattle and Denver. Since 2010, the population of these two cities grew 15.39% and 14.87%, respectively. I’m going to say it’s because of the skiing and snowboarding. Half-joking. For the top 25 large cities ranked by 2010-2016 growth rate, click here.

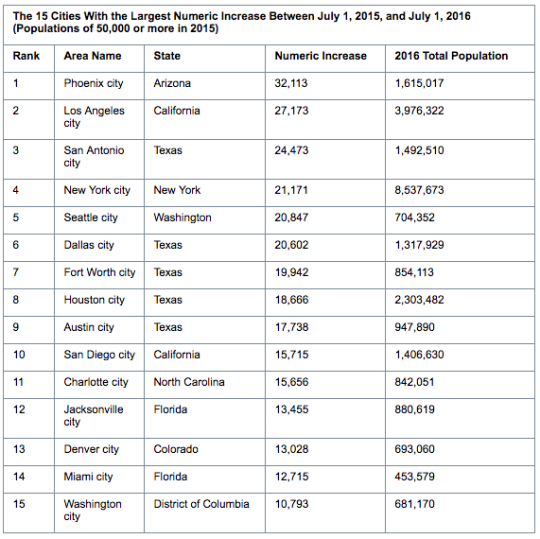
    In terms of absolute humans, Phoenix had the largest numeric increase between 2015 and 2016: 32,113 or about 88 people per day. After Phoenix it’s Los Angeles (27,173), San Antonio (24,473), New York (21,171), and Seattle (20,847). These are all city proper figures.

    It’s also worth noting which large cities aren’t growing. From 2015 to 2016, Chicago fell -0.32% and Detroit fell -0.52%. Philadelphia was only slightly positive at 0.19%. Going back to 2010, Chicago is still flat at 0.27% and Detroit is even more negative at -5.39%. Philadelphia is 2.5%.

    Follow the sun and the sprawl.

    The below charts are from the United States Census Bureau.

    imageimage

  • Today I am N+1

    Today is my birthday. 

    I am one year older, at least at face value. This got me thinking about something I read a number of years ago on Fred Wilson’s blog called The N+1 theory. The basic premise is as follows: whatever it is, there could be one more. It is an optimistic viewpoint that emphasizes continuous improvement and change.

    For example, let’s say you’re designing a building and you’re trying to make it as energy efficient as possible. You might think that you’ve arrived at the most efficient outcome, but in fact you’re probably just sitting at N. Stretch yourself. Go for N+1.

    Let’s say you’re working out at the gym and you feel you’ve done as many reps as you could possibly do. Well, if you stretched yourself, you could probably do N+1. People who lift weights will also tell you it’s that one additional rep that counts the most. 

    The mantra: Do as many or as much as you can possibly do (N), and then do one more (+1). The N+1 theory is a growth mindset. And if you apply this thinking throughout your life, I am sure you would see many benefits.

    At the same time, one could imagine this theory being applied in a destructive way. In a relationship, for instance, is it healthy to think of your significant other as N, meaning that you should be looking for someone better? That N+1. This strikes me as an unhappy way to live. I would prefer to apply this theory in a productive way. 

    Whatever the case may be, today I am firmly N+1. And I feel good about that.