Daily insights for city builders, delivered every morning at 6 AM ET. I’m Brandon Donnelly — a Toronto-based real estate developer and founder of Globizen. I’ve been writing here since 2013.

Tag: economy

  • 1,688 new condominiums were sold last quarter in the Toronto region

    Urbanation just released its Q2-2024 condominium market survey for the Greater Toronto & Hamilton Area (GTHA), and we should probably talk about some of the data:

    • The new condominium market reported 1,688 sales in the quarter. Outside of Q2-2020 (the pandemic), this is the lowest in the past 20 years. Note: This number is self-reported by developers.
    • Of the 3,625 homes launched for pre-sale during the quarter, only about 17% got absorbed/sold. That’s about ~616 homes, which isn’t very much when you spread it out across the region’s projects.
    • Unsold inventory increased to 25,893 homes. Urbanation equates this to 34 months of supply, versus a more “balanced level” of 10-12 months. This number breaks down to 15,157 homes in pre-construction projects, 9,788 homes in projects under construction, and 948 homes in recently completed buildings.
    • This is higher than Urbanation’s 20-year average, but the way I see it is that the ~15k homes in pre-construction projects could very quickly evaporate. If those projects don’t get to construction (and most probably won’t in the short term), then that inventory will disappear from the market. On the other hand, the ~11k homes under construction or recently completed is a hard number. These homes exist, or will soon exist, and they’ll need to get absorbed at some point.
    • There are also going to be homes that are currently sold, but where buyers ultimately say “yeah, I’m not going to be able to close.” So there will be some non-zero percentage of homes that will need to be reabsorbed. I don’t know what this percentage will be, but if it’s something like 5%, that’s not nothing. (See below for the number of condominiums under construction right now.)
    • Not surprisingly, average asking prices for unsold homes only declined about 2.6% over the past year. Prices have remained markably sticky. And this is how you know that development happens on the margin. Because developers are infinitely better off selling homes and starting construction, compared to holding lots of unsold inventory and starting construction, whenever. The fact that developers aren’t dropping prices to sell more homes demonstrates that they can’t. They’re hitting the floor of financial feasibility.
    • Finally, last quarter saw 727 new condominium homes start construction. In theory, this could have been a single tall building, though that probably wasn’t the case. As new starts fall, the number of condominiums under construction will naturally also fall. The current number is 87,508 homes, which is almost 19,000 less than a year ago. I expect this number to keep coming down.
  • The US is building a lot of apartments right now

    As of November 2023, it was estimated that there were 988,000 homes under construction in multi-family buildings containing 5 or more units. This is in comparison to 680,000 single-family homes, according to US Census data. (Looking at the below graph, it’s also interesting to see how the supply of single-family homes dropped off after the global financial crisis and multi-family apartments took off.)

    All of this means that in 2024, the US is on track to complete more apartments than it has in many many decades. In fact, exactly similar to what we experienced here in Toronto, if you want to find a comparable multi-family supply number, you need to go as far back as the 1970s (see below). Of course, the US had fewer people back then, and so on a per capita basis, it was building more housing.

    Still, all of this new supply is having an impact. Apartment List recently published its national rent report, over here. And overall, it found that:

    Rent increases are currently being moderated by a robust construction pipeline expected to deliver a decades-high number of new apartment units in 2024.

    More specifically, they found that the cities with the most supply are now seeing the largest rent declines:

    Many of the steepest year-over-year declines remain concentrated in Sun Belt cities that are rapidly expanding their multifamily inventory, such as Austin (-7.4 percent year-over-year), Raleigh (-4.4 percent), and Orlando (-3.9 percent).

    If you’re an apartment developer, this is not what you want to see. It means that increased competition is creating downward pressure on rents and that vacancy rates are probably rising. But if you’re someone looking to rent an apartment, this is exactly what you want to see. You want more affordable housing. And so, as a consequence, you want more homes to be built. Because when supply outstrips demand, this is what you get.

    Charts: Apartment List

  • The Elephant Graph

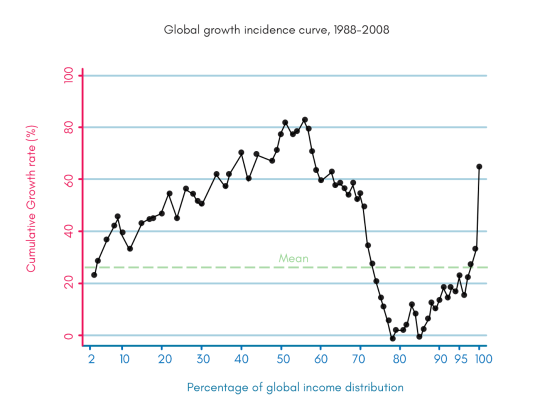
    The following chart was created by Branko Milanovic (Visiting Presidential Professor, Graduate Center, City University of New York and Senior Scholar, Luxumberg Income Centre) and by Christoph Lakner (Economist in the Development Research Group at the World Bank.

    image

    It is known as the “elephant graph” because, well, it kind of looks like an elephant. The trunk is on the right.

    What it shows is global cumulative real income growth from 1988 to 2008 for every percentile around the world.

    The trunk on the right is the world’s 1%. Their income is up.

    The 50-60th percentile range is also up. These are people in the developing world who started making a bit of money as a result of industrialization. In percentage terms things look good, but in absolute terms they’re not making a lot of money. Still, they are becoming better off.

    Where things fall apart is in the 75-90th percentile range. These are essentially the lowest income folks in the developed world. Their incomes haven’t been growing at the same rate and, in some cases, their incomes decreased in real terms. They are falling behind.

    Kaila Colbin wrote a Medium post about this graph and asks whether the exponential growth in technology that we are seeing today, will end up creating more jobs than it eliminates – as it did before in the past. 

    She also wonders whether the dip we are seeing in the 75-90th percentile range could spread left as automation eliminates jobs for those folks in the developing world.

    These are important questions.

  • World after capital

    Albert Wenger is currently in the process of writing a book called World After Capital. The book isn’t finished yet. It still exists in a crude rough draft form. But already he has made it freely available online. You’re also welcome to comment and contribute to the book as he works on it.

    Why has he done it this way? 

    Because this format of publishing is in line with where he believes the world is heading. He believes we are headed towards a world where new forms of surplus – brought about by technological innovation – will create greater levels of freedom: economic freedom, informational freedom, and psychological freedom.

    His overall thesis is that the world has been moving through a series of scarcities. As hunter and gathers, the scarcity was food. In our agricultural period, we learned how to create food surpluses (which freed up more of our time), but it then produced land scarcity. Once the industrial revolution hit we once again freed up more of our time through surpluses, but then the scarcity became centered around capital. We also started to negatively impact the environment. Today, as we clearly move away from the industrial economy towards a knowledge and information economy, Albert believes the new scarcity is attention. (I wrote a related post about a month ago.)

    If you’re interested in this topic and don’t feel like diving into his book, I suggest you watch this 23 minute presentation by Albert Wenger. I watched it this morning and he talks about everything I mention above. 

    Here’s one of his slides that I felt was important to share:

    Why it’s interesting to think about this shift is because there will inevitably be positive and negative outcomes associated with it; there will inevitably be groups who, probably because of self-interest, would rather cling to the past; and because there are pressing global issues that we need to be focusing our attention on – issues such as climate change.

    I can’t help but wonder about all the ways this shift could reverberate through the economy and our cities. Earlier this week I wrote a post about architecture as a tool for capital. But with our current fixation on “starchitecture”, one could argue that we have already transformed architecture into a new tool – a tool for grabbing attention. If you believe that attention is the new scarcity, then this makes perfect sense.

  • Should I stay or should I go?

    I’m listening to The Foreign Desk this morning while I have my coffee. Steve Bloomfield is interviewing two different politicians: one who believes Britain should remain in the EU and one who believes Britain should leave the EU. 

    (Each interview is about 15 minutes short.)

    The back and forth is largely centered around two things: the economy and immigration. Will the British economy be better off in or out of the EU? And on the immigration front, will “in” translate into millions of Turks flooding into Britain should Turkey join the EU?

    For those of you who haven’t been following, Britain will be holding a referendum on June 23rd (2016) to decide whether they stay or go.

    My general view is that a strong economy should trump concerns over foreigners. But I don’t feel as if I know enough about this precise topic to take a firm position.

    Regardless, I very much enjoyed The Foreign Desk episode this morning and I would be open to discussing this issue in the comments below if any of you are also interested.

  • What technological deflation could be doing to the economy

    Earlier in the week, I came across this post (via Fred Wilson), arguing that rapid technological progress is causing systemic deflation in the broader economy.

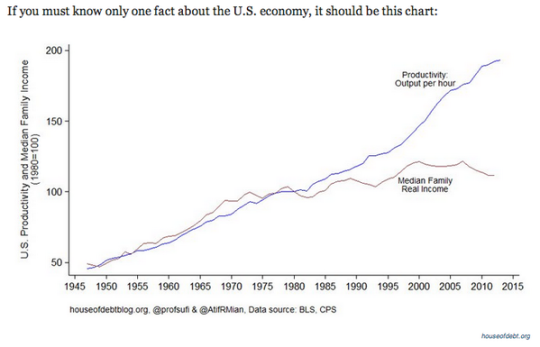
    Here’s a chart that illustrates the author’s point:

    What is happening here is that despite advances in technology and increases in productivity, real wages have been stagnant for decades. (This chart is for the US, but it likely applies to many other countries.)

    This is an interesting paradox. For a long time, increases in productivity were met with corresponding increases in income. So why the divergence?

    The author believes that it’s because the gains brought about by “extreme technological progress” are being unequally applied to the economy. In other words, they do not benefit the majority of people. He then goes on to argue that we could be entering an entirely new macroeconomic era: 

    “Economic growth may be over soon, at least in absolute terms. On the other hand that will be at least partially offset by the technological deflation. So instead of the decline of the innovation it will be just the opposite, the explosion of the innovation that will turn the economy to the decline. And moreover, it will not be a tragedy since we will be able to produce higher standard of living with fraction of the GDP today. Few adjustments needs to be done into our economic system to cope with the change for sure.”

    When you read things like this it makes the idea of a “basic income guarantee” seem far more palatable.

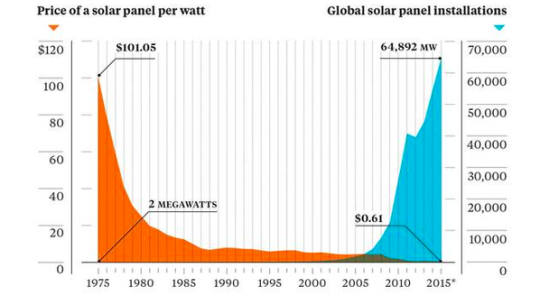
    The other chart that stood out to me was this one below, which shows the declining cost of solar panels and the rise of global solar panel installations. 

    It’s a great reminder that it’s only a matter of time before we wean ourselves off of oil. And, that we could be headed towards some sort of third industrial revolution where the marginal cost of energy is almost zero. Already about 25% of Germany’s electricity comes from renewables.

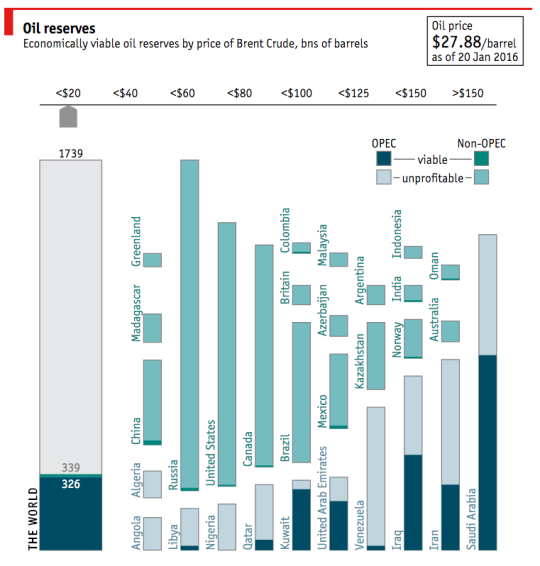
    On that note, I am going to end with a fantastic interactive chart from The Economist (screenshot below) that outlines oil reserves around the world by country. If you click through to their website, you can then toggle the price of oil (per barrel) to see how much of those reserves are actually viable.

    With the price of oil where it is today ($27.88 per barrel as of January 20, 2016), there are only a handful of countries with profitable oil. I am sure you could have guessed which ones.

    What will happen if, or should I say when, that oil is no longer needed? 

  • Balancing oil and ideas

    Colorado Sunset by Travis Bredehoft on 500px.com

    https://500px.com/embed.js

    Canada is a resource rich country. And one of the things that commonly happens to countries with a lot of resources is that they begin to myopically focus on the immediate gains from resources at the expense of long term innovation and economic development. 

    This is known as the “resource curse.”

    The Martin Prosperity Institute here in Toronto recently published a report that looks at this exact topic: Canada’s urban competitiveness through the lenses of its resource economy and its knowledge economy. In the end, Richard Florida and Greg Spencer conclude that two can and should work together, but that we need to stop neglecting our cities:

    “The oil and gas industry is not necessarily a constraint on the creative economy, but in the past decade or so it has come to dominate thinking around economic development policy-making. It is time to use the resources from the energy economy to build a more secure future as an urban knowledge economy. We can also use
    talent and technology to deepen and expand the resource economy.”

    And one of their key recommendation is something I have argued for many times here on Architect This City:

    “A New Federalism for Cities: It is time to give cities the taxing and spending powers they require. Cities must be given more control over their own destinies if they are to prosper
    in the 21st century.”

    Now, here are a few interesting charts from the report.

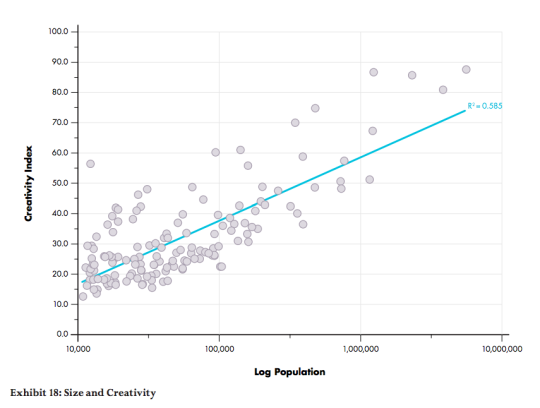
    This first one looks at the relationship between a city’s population and its creativity levels. The two are positively correlated, which means that, in this context, bigger is better.

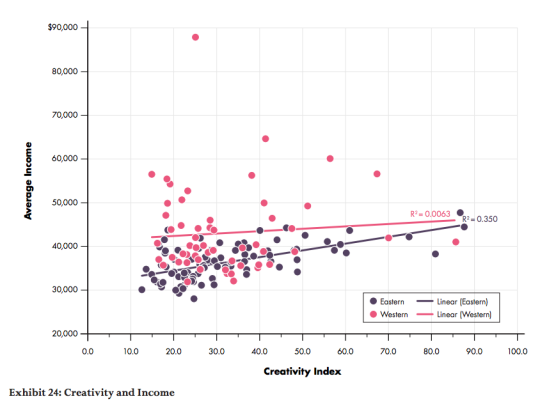
    This second one splits Canada in half – east and west – and then looks at how average income levels are affected by creativity levels (the knowledge economy). Here we see that in eastern cities, income levels are positively correlated with creativity levels. But in western cities, changing creativity levels have almost no impact on income levels. 

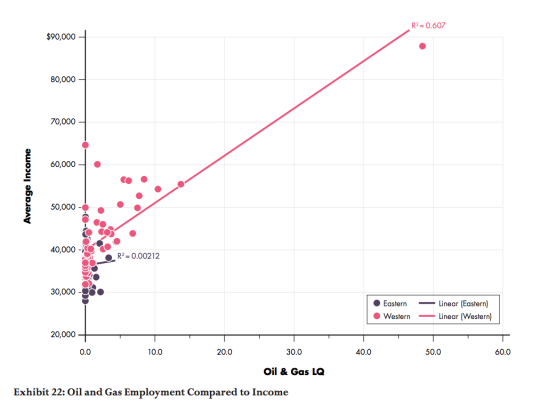
    Finally, this third chart compares the relationship between oil and gas employment (LQ = location quotient) and average income levels. What it finds is that income levels and oil and gas employment are positively correlated in the west, but there’s almost no relationship in eastern cities. 

    The way to read this chart is to think of the LQ as the employment multiple relative to the national average. So for example, a LQ = 10 means that the oil and gas employment levels are 10 times the national average. As you probably guessed, the pink dot way out on the right is Fort McMurray.

    If you’d like to read the entire report, you can do that here. I hope that our new Prime Minister, Justin Trudeau, will read reports like this and spend more of his efforts investing in our knowledge economy – which means investing in our cities.

  • Marginal cost = 0

    Earlier this week I wrote a post called: The pull from services to products. And in it I made mention of the fact that part of what’s driving this pull towards products is that the marginal cost of servicing additional users or customers is almost nothing in a world of internet services and products.

    Well the reality is that this phenomenon is driving a hell of a lot more. It could – and probably will – fundamentally change almost all aspects of the economy.

    I know that sounds like a pretty audacious statement, but if you watch the following 10 minute talk by Albert Wenger (Union Square Ventures) you might start to feel the same way. He outlines 5 changes being driven by the fact that in the digital world, marginal cost = 0. The impacts go well beyond tech, capturing sectors such as transportation and industrial real estate.

    [youtube https://www.youtube.com/watch?v=sVEtTzlqsoE?rel=0]

    If you can’t see the video, click here.

  • Our economy doesn’t suck

    image

    On Friday my friend Paul Crowe (of BNOTIONS) wrote the following Facebook post (rant) about the retail landscape here in Canada. It was a direct response to the claims that the recent loss of Target, Mexx, and Sony is “a warning sign for our economy.” If the text is too small below, you can also click here to read it on my wall.

    image

    I would say that competition did impact these retailers, but the key message remains the same: there’s nothing wrong with failure and companies going out of business (although success is obviously a more ideal outcome).

    And it shouldn’t necessarily be interpreted as a bad thing for our economy. In fact, a lot of the time it’s something quite healthy. When companies stop being competitive, the market is supposed to punish them. That’s how this game works.

  • The middle class myth — a conversation with Marc Andreessen

    New York Magazine recently published a really great conversation between Marc Andreessen and Kevin Rose. Marc cofounded Netscape way back when, and now runs a venture capital firm.

    In addition to technology, the conversation touches on a bunch of different topics such as why it’s beneficial to be an optimist and why change can be difficult for people to accept.

    But they also hit on a number of broader economic shifts, such as the replacement of labor by machines, and the rise and decline of industrial production in the US. Here’s a snippet on that latter point:

    You’ve described the middle class of the 20th century as a myth.

    There are two middle classes. There’s the historical middle class—which is the bourgeoisie—starting in the, like, 1600s. This was the businesspeople and the traders, the merchants, the butcher, the baker, the general-store manager, the guy who was going off to China to go get silk and bring it back. Businesspeople.

    But in the 1940s something really significant happened, which is we bombed the rest of the industrialized world. And so the industrial base of Germany was obliterated. Japan was reduced to rubble. The rest of Continental Europe was bombed. England was bombed. The industrial base of the world was bombed. The one major industrial country that wasn’t bombed was the United States. So the United States became the monopoly producer of industrial goods.

    The army bombed the American middle class into existence?

    It was an accident of history. We had a window of opportunity which we took full advantage of. We had this window from basically 1945 to 1966, 1968, in which we were basically running unopposed. In that window, all kinds of wonderful things happened. One of the things that happened was the rise of this new idea of the middle class, which there was no historical precedent for, which was college-level wages for high-school-level education. As long as there’s no competition, it’s all well and good. The minute the Japanese show up, the minute the Germans show up, it just all falls apart.

    Click here for the full conversation. It’s an interesting read.