Daily insights for city builders, delivered every morning at 6 AM ET. I’m Brandon Donnelly — a Toronto-based real estate developer and founder of Globizen. I’ve been writing here since 2013.

Tag: dutch

  • Holding back the sea, in Venice, maybe

    Venice has been keeping flood records for 150 years, though it is generally understood that the city has been regularly flooding since the very beginning. It usually happens between the fall and the spring and the earliest record is believed to be from the 6th century.

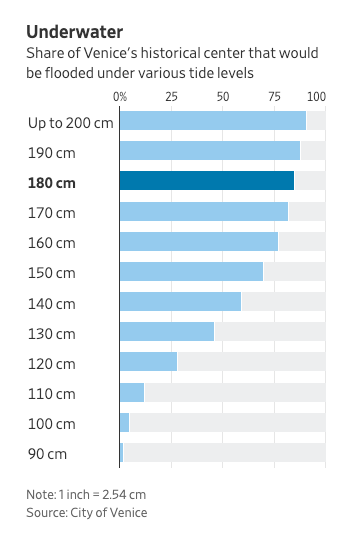
    This past week, Venice saw its acqua alta (or high water) peak at 187cm (6’2″) above its normal level. This is the second highest number on record and is just below its 1966 peak. At these numbers, about 80% of the historic center is underwater. Here is a chart from the WSJ explaining that:
    Venice has been working on a flood management project called MOSE since the 1980s. The name is an acronym, but there’s a deliberate biblical reference here. Remember when Moses parted the red sea?

    The project has been mired in engineering delays and corruption scandals, and so it’s not yet operational. If it were, it would have, in theory, protected the city this past week. 2022 is the anticipated completion date, but I don’t know if that’s realistic or not.

    The system consists of 78 mobile gates that fill with water and sit flat on the seabed when the tide is low. When a high tide is predicted, the gates are then to be pumped with air so that they rise (hinged on one side) and close off the three inlets that connect the Venetian Lagoon to the Adriatic Sea.

    As I was reading about this project and everything else that has been going on in Venice this past week, I became curious about how exactly the Dutch have been managing to hold back the sea. I mean, a big chunk of the Netherlands sits below sea level.

    If you’re also curious, here’s a video that explains how they do it.
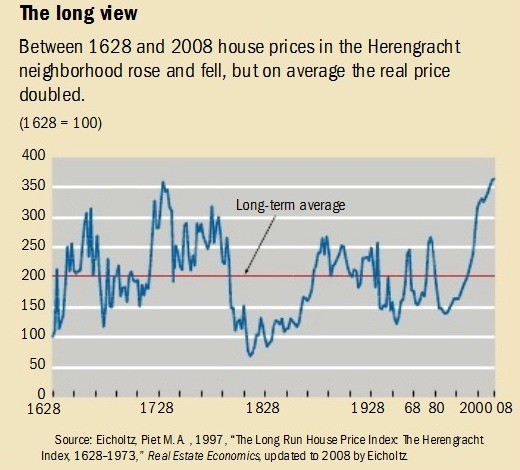
  • An even longer view on home prices — this time in Amsterdam

    In the comments of my recent post about Manhattan real estate prices during the Great Depression, a regular reader of this blog shared this terrific blog post (and corresponding research paper by Piet Eichholtz) about house prices along the Herengracht canal in Amsterdam from 1628 to 1973. Later it was updated to include up to 2008. It’s a long run house price index.

    Probably the first thing you’ll notice is that the index is highly volatile. Amsterdam enters its Golden Age, creates the world’s first stock exchange, and becomes the wealthiest city in the western world – house prices go way up. The tulip mania bubble pops – house prices go way down. It’s not until after World War II that prices sort of start to stabilize and increase, maybe, more consistently.

    In nominal dollars, the house price index increases 10x over the study period. But in real dollars most of that disappears. The biennial increase (that’s how the study was done) over the same period of time is just 0.5%. That translates into a doubling of house prices, which may seem quite good, except that remember it’s over a 380 year time period.

    image

    The Herengracht canal is a particularly good study because it was and has remained (or so I’m told) a desirable part of Amsterdam. This is an attempt to control for the variable that maybe some of the volatility could be explained by the area simply falling out of favor. (As a quick sidebar, the Herengracht was one of the first canals laid and dug out around the original city center of medieval Amsterdam during its Golden Age.)

    Generally, this finding is in line with one that economist Robert J. Shiller famously published a number of years ago where he argued that, when you correct for inflation, home prices actually look remarkably stable over long-run forecasts. In one study, he looked at 100 years of US home prices ending in 1990. Real home prices increased about 0.2% a year. What an outstanding hedge against inflation.

  • How a 5,000-stall bicycle parking garage works in Delft

    This past February, a new central train station opened up in Delft in the Netherlands. As part of the train station, there’s an underground parking facility for 5,000 bicycles.

    Here’s a video of how it all works:

    [youtube https://www.youtube.com/watch?v=UuhLv1AN0bE?rel=0&w=560&h=315]

    Isn’t it amazing what you can achieve when you decide to make something a priority?

  • Rotterdam reinvents the urban food market

    image

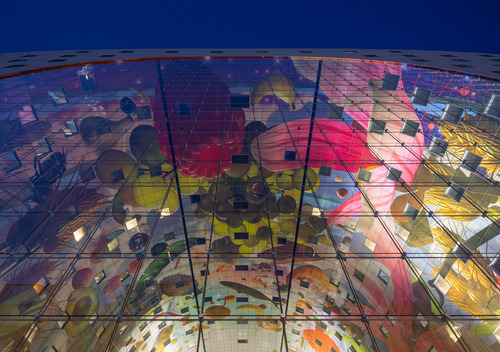
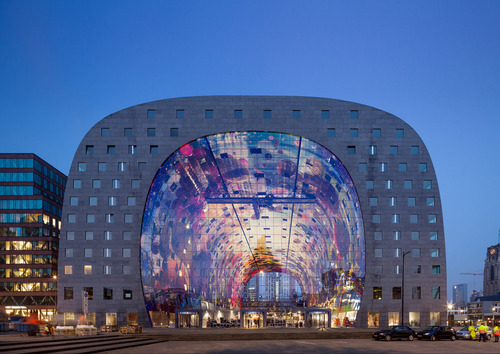
    Every now and then a piece of architecture comes along that makes you feel like your city should be more beautiful – or at least very least: bolder. In this case, it’s the new Market Hall in Rotterdam, which has been making the rounds on the internet since it opened last week. It may not be everyone’s cup of tea, but I find it really exciting.

    Designed by Dutch architecture firm MVRDV, the Market Hall is a 1.1 million square foot mixed-use building consisting of residences (102 rental apartments and 126 for sale apartments), a food market, a supermarket, a public space, and a 1,200 stall parking facility. But before I say anymore, here’s the money shot:

    image

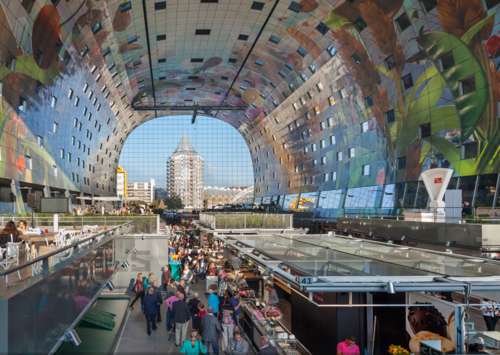
    And here’s what it looks like from the inside of the market:

    image

    In the middle of the building is the food market. At night when it closes up, it then becomes a well-lit public space. The entire central area is enclosed, but well connected visually to the outside through a big and fancy glass facade.

    The apartments wrap the central market and were constructed using standardized modules (despite the unique form). The spaces that require natural light face outward and all the spaces that do not require natural light (by Dutch law), such as the kitchens, face inward towards the market. 

    There’s a grocery store 1 level below grade (to help supplement the market) and all parking and loading is done underground. This means that the building itself has no real backside. Most buildings typically have an ugly loading and “back of house” area – the building’s ass if you will. In this case, the entire perimeter of the building is urban and accessible.

    Finally, on the ceiling of the market is a massive mega-mural designed by Dutch artists Arno Coenen and Iris Roskam. Click here for a 360 degree panorama. It’s wild. 

    So what do you think of this building? Would you like to have it in your city? And would you consider living in one of its apartments? I would.

    Images: MVRDV

  • Minimal effort; maximum engagement

    I’ve been blogging almost every day for 3 months straight. It’s been a hugely rewarding process and I absolutely plan to continue. Though some days it’s hard to find something to write about. And some days it’s hard to find the time.

    One of those days was 5 days ago. I was busy and so I decided to post a video instead of spending a lot of time writing a post. I posted a video explaining how the Dutch design their street intersections to accommodate cyclists. You can find that post here.

    Well, it turns out that the post I easily spent the least amount of time preparing has now become, by far, the most popular post I’ve ever done. As of today, I received 460 notes via Tumblr. That includes likes and reblogs. And, as a result, my engagement graph now looks like this:

    I can’t even make out what the numbers were before this post blew up. This is really interesting to me, because I remember questioning if I should even post the video in the first place. I thought it may be a bit dry and perhaps too technical.

    It just goes to show that sometimes you can’t predict what will catch on.