I’m taking next week off so that I can respond to emails from various places in Ontario and Quebec instead of from my desk. The out of office messages really fly at this time of year, so it’s usually a pretty good time to try for a recharge.
Because of that, this post feels appropriate.
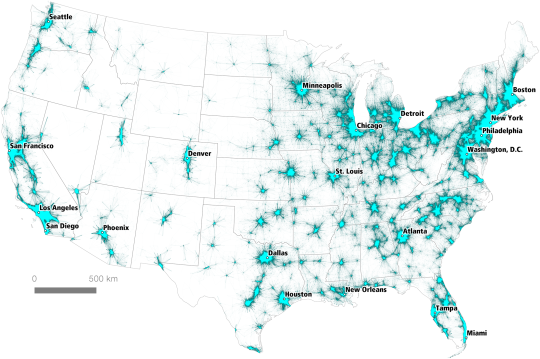
Sahil Chinoy of the Washington Post recently looked at anonymous cell phone and vehicle data (from Here Technologies) to see how far you could drive in one hour if you were trying to escape the downtown of various U.S. cities on a Friday afternoon in the summer.
This exercise was done for 3 departure times on July 28, 2017: 4pm, 7pm and 10pm. The mappings all leverage 3 years of historical speed data.
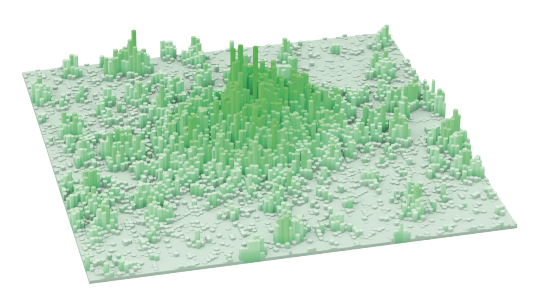
Here is a first set of maps showing a few cities in the northeast and in the mid-atlantic. Every city is shown at the same scale so that they can be easily compared.
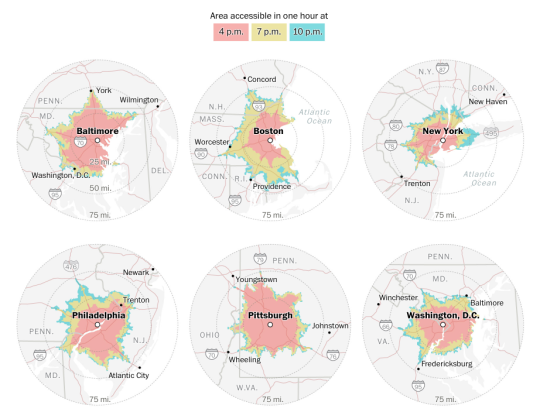
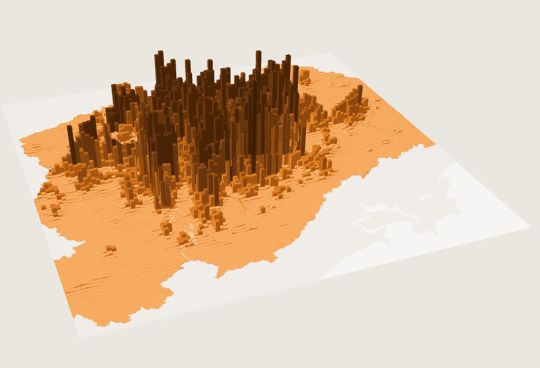
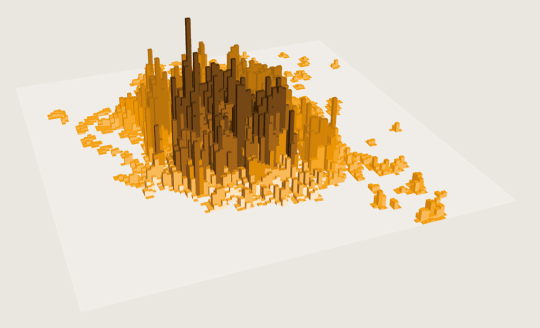
And here is a second set of maps showing a few, more car-oriented, cities.
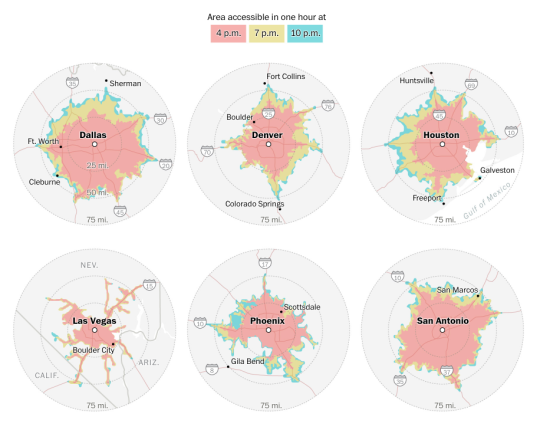
Not surprisingly, older transit-oriented cities like New York don’t do well in this contest. No matter what time you leave, it’s hard to make it past 30 miles. Whereas in the case of Vegas, it doesn’t really matter what time you leave. You should be able to clear 50 miles.
That’s the other interesting thing to note about these maps – the spread between distances at the various times.
I’m sharing these because I’m a sucker for diagrams, but I don’t think they tell the whole story. The modal splits and the population and employment densities are all very different across these cities. New York’s core competency is in moving lots of people in trains, not in cars.
Although, perhaps the ironic thing about these diagrams is that a tighter drive radius might actually say something about how efficiently land is being used.