Daily insights for city builders, delivered every morning at 6 AM ET. I’m Brandon Donnelly — a Toronto-based real estate developer and founder of Globizen. I’ve been writing here since 2013.

Tag: cycling infrastructure

  • More people are cycling in Chicago

    One of the common criticisms of bike lanes is that most people don’t want to cycle in the winter. I mean, just look at Montreal’s winter cycling retention ratio.

    But that doesn’t mean that you shouldn’t invest in cycling infrastructure. Chicago, for instance, has been building out cycling infrastructure over the last few years (2020-2023) at an average rate of approximately 30 miles per year. This is double its rate from 2011-2019. And the results show.

    According to recent data from Replica and the Chicago Department of Transportation (CDOT), Chicago saw the highest growth in cycling among the 10 largest cities in the US between fall 2019 and spring 2023.

    Biking overall was up 119%. Crosstown trips were up 180% (bike trips that spanned across four or more neighborhoods). Trips related to shopping were up 117%. And notably, zero-car households were up 207%.

    Remember, this is a city that basically has the same weather as Toronto. It gets cold in the winter. And sometimes it snows. But clearly if you build good cycling infrastructure, people will use it.

  • How wide should a bike lane be?

    The Dutch now believe that the number is 230cm. This is an increase from a previous recommendation of 200cm. The thinking behind this number is roughly as follows. Apparently there are Dutch laws stipulating that bikes can’t be wider than 75cm. So this is the starting point.

    But since it’s impossible to always ride in a perfectly straight line, there seems to be a generally accepted rule that, at an absolute minimum, cyclists need about 100cm of width to themselves.

    If you now double this so that two people can ride side-by-side, you’re at 200cm. This is an important design criteria because the Dutch also seem to believe that (1) cycling is a social activity and (2) a child should be able to ride beside their parent. (Love this!)

    Finally, add in a bit of buffer so there’s room to pass slower cyclists and/or nobody feels like they’re going to crash into oncoming cyclists, and you get to 230cm as the ideal width of a single bike lane.

    I’m not sure I had given this much thought before, so I look forward to scrutinizing (and possibly measuring) every bike lane I ride in going forward.

  • Paris vs. New York bike lanes

    It’s one thing to have bike lanes. And it’s another thing to have really generous bike lanes. The above video by Streetfilms does a good job of comparing Paris to New York City, and showing just how far Paris has come in terms of cycling infrastructure. Some of you might remember that in the fall of last year, Paris announced plans to become a “100% cycling city.” This was a follow-on to their plan vélo 2015-2020, which saw a doubling of the city’s bike lanes. The current plan, which covers 2021-2026, includes 130 km of new bike lanes and 52 km of pandemic lanes that have been (or will be) made permanent. But again, it’s one thing to have a lot of bike lanes. And it’s another thing to have a lot of wide bike lanes that look like the ones in this video.

  • Paris announces plan for “100% cycling city”

    Paris just announced plans to become a “100% cycling city.” A follow-up to plan vélo 2015-2020, which saw a doubling of the city’s bike lanes, plan vélo 2021-2026 includes 130 km of new bike lanes and 52 km of pandemic bike lanes that will now be made permanent.

    In addition to cycling lanes, the plans include new bike parking, new transit integrations, and a bunch of other things that are meant to strengthen the overall ecosystem in the city. The total budget for this second plan is about €100 million, which will bring the total cycling investment over the last 10-11 years to about €250 million. This is a serious commitment to cycling.

    It’s also a good example of one of the things that we have been talking about on this blog. This pandemic forced us to rethink how we allocate urban space — everything from outdoor restaurant patios to bike lanes. And as we can see here, many of the positive changes are not surprisingly starting to stick.

  • Toronto approves 40 km expansion of cycling network

    This week, Toronto City Council approved the largest ever one-year expansion of bike lanes in the city — a total of 40 km. It passed 23 to 2. Here is a map of the approved routes:

    The Bloor West extension is being accelerated. This will take the Bloor Bikeway out to Runnymede and High Park in the west (close to our Junction House project).

    New expansions of the network in the core include Bloor Street East, University Avenue, Dundas Street East, and Danforth Avenue (which also happens to connect another one of our development sites on Dawes Road).

    Bloor, University, and Dundas are expected to be among the first installations. The idea here is to have them mirror some of our subway lines and fill the mobility gap as many people shy away from transit in the short-term.

    All of this wouldn’t have happened without COVID-19, at least not this quickly. I’m certainly not happy about a pandemic, but as a car owner and fair-weather cyclist, I am happy about these new bikeways and I am happy that we were compelled into action.

  • Crowdsourcing unsafe cycling conditions with a small yellow handlebar button

    Hövding – a Swedish company best known for its radical airbag cycling helmets (definitely check these out) – is currently crowdsourcing unsafe conditions and cyclist frustration in London.

    Working with the London Cyclist Campaign, they distributed 500 yellow handlebar buttons. Cyclists were then instructed to tap these buttons whenever they felt unsafe or frustrated with current cycling conditions. 

    Here’s what the button looks like:

    Every time the button is hit, the data point gets logged to a public map and an email gets sent to the Mayor of London reminding him of his promises around cycling. Both of these things happen via the rider’s smartphone.

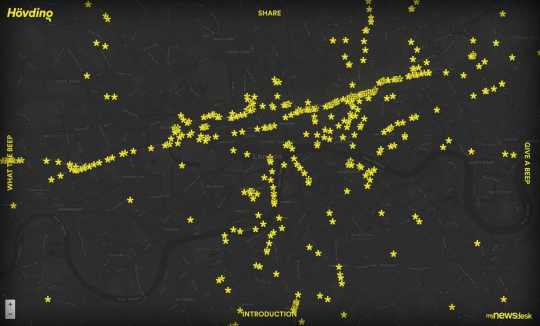
    Here’s what the public map looks like at the time of writing this post:

    Not only does it tell you pain point locations, but it also seems to suggest the primary cycling routes. I think this is a brilliant initiative because, it’s entirely user-centric. It’s telling you how people feel on the ground.

    Supposedly, Hövding is actively looking for other cyclist groups around the world to help them distribute their buttons. So if you’re a group in Toronto or in another city, I would encourage you to reach out to them. The more data the better.

  • Barcelona’s new superblocks

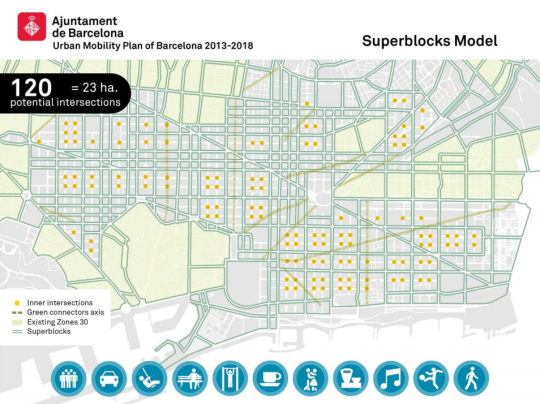
    Barcelona is in the midst of dramatically rethinking its urban fabric to address issues around urban mobility and climate change. Initially laid out in this 2014 Urban Mobility Plan for Barcelona, the city is now implementing something it calls superilles (or superblocks in English).

    Here’s what it looks like:

    The idea is to concentrate transit and vehicular traffic onto the edge of these new superblocks and then convert the interiors into livable spaces for pedestrians and cyclists. Here’s a description from the Agència d’Ecologia Urbana de Barcelona:

    “Superblocks are made up of a grid of basic roads forming a polygon, some 400 by 400 meters, with both interior and exterior components. The interior (intervía) is closed to motorized vehicles and above ground parking, and gives preference to pedestrian traffic in the public space. Though the inner streets are generally reserved for pedestrians, they can be used by residential traffic, services, emergency vehicles, and loading/unloading vehicles under special circumstances. The perimeter, or exterior, of Superblocks is where motorized traffic circulates, and makes up the basic roads.”

    The result is going to be an absolutely radical shift in the amount of public space given to drivers, pedestrians, and cyclists. When their 2014 report was issued, it was estimated that 73% of public space was allocated to cars (versus pedestrians). This plan will completely flip that ratio. With the superblock model, it is estimated that 77% of public space will now be allocated to pedestrians.

    Here’s what that is expected to look like…

    Before:

    After:

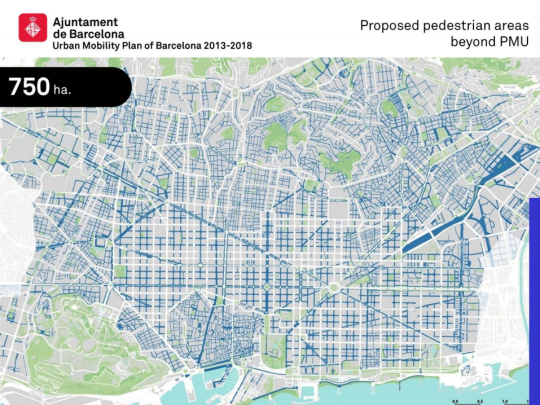
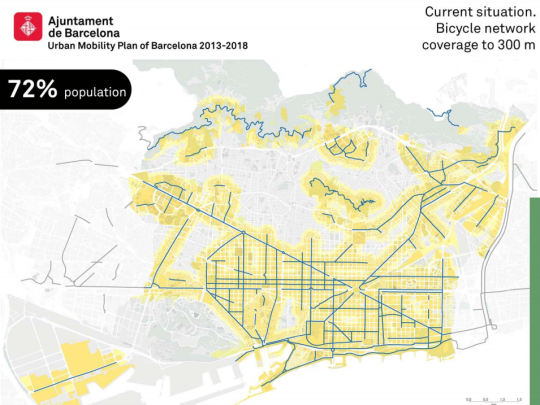
    There are also plans to expand the bicycle network to roughly 95% of the city’s population.

    Before:

    After:

    If any of you are from Barcelona, I would love to hear a local perspective on this mobility plan. Were and are there cries of a war on the car?

    Images: Top image from Tom Walk (Flickr); Maps from Urban Mobility Plan of Barcelona 2013-2018