Daily insights for city builders, delivered every morning at 6 AM ET. I’m Brandon Donnelly — a Toronto-based real estate developer and founder of Globizen. I’ve been writing here since 2013.

Tag: china

  • Applications to US business schools are declining

    Applications to American business schools, including MBA programs, have fallen for five straight years according to this recent WSJ article.

    Compared to last year, business school applications to US schools are down about 9.1%; whereas they have been rising in other parts of the world. If you look at the change in applications from international students, the drop is even more significant — about 13.7%.

    Here are two charts from the WSJ:

    There are a couple of possible explanations for this. Tech is/has been hot. I would imagine that space has been absorbing many people who would have historically gone to do an MBA.

    But perhaps more significantly, stricter immigration policies are making it harder for international students to come to the US. At the same time, top tier alternatives are emerging around the world, such as in China.

    China exports more business school students than any other country and they are by far the largest international student base in the US. But the numbers are coming down. At the peak in 2015, the US issued nearly 275,000 student visas to people from China. By 2017, that number had more than halved to 112,817.

    Out of curiosity, I decided to look up the class profile for the most recent Rotman MBA cohort (my alma mater). 70% of the class was born outside of Canada. That’s not surprising.

    Charts: WSJ

  • New Monocle City Series to launch in Chengdu

    Today, Monocle announced a new “City Series,” which will take the form of a focused half-day summit. The objective is to explore the urban issues facing mayors, developers, investors, and citizens. The first summit will take place this November 4 (2019) in Chengdu — the capital of the Sichuan province in China.

    For those of you who aren’t familiar with Chengdu, it’s a modest Chinese city with over 14 million people in the administrative area and over 10 million people in the urban boundary (2014 figures). It is the 5th most populous agglomeration in China.

    I can’t vouch for the quality of this new series, since this will be the first one, but Monocle has been running a longer, multi-day, quality of life conference for a few years now. Mostly, I am intrigued by the selection of Chengdu as the inaugural city for this new series. I take it as evidence that interesting things are happening there.

    Image: Monocle

  • Boom babies (of China)

    A few years ago I wrote a post talking about “depression babies.” In it, I cited a research paper that looked at the impact of macroeconomic shocks on people’s willingness to take on financial risk in the future. The term “depression babies” stems from the Great Depression and how it is believed to have impacted risk taking, savings rates, and probably many other things.

    I was reminded of this when I read this recent article in the WSJ talking about how the Chinese have started spending — and taking on the debt — like Americans, particularly among Chinese under 30. It is the inverse of the depression baby phenomenon. In this case, it is arguably years of economic expansion leading to greater comfort around financial risk.

    Here are a couple of figures from the article:

    JPMorgan estimates China’s ratio of household debt to gross domestic product will climb to 61% by 2020. That’s up from 26% in 2010 and higher than current levels in Italy and Greece.

    The level in the U.S. is about 76%, after falling from 98% in 2006, according to the International Monetary Fund.

    By another measure—the ratio of household debt to disposable income—China appears to have already surpassed the U.S. Its ratio reached 117.2% in 2018, up from 42.7% in 2008, according to calculations by Lei Ning, a researcher at the Institute for Advanced Research at Shanghai University of Finance and Economics. The U.S. peaked at 135% in 2007 and dropped to 101% in 2018.

    Not surprisingly, the article goes on to talk about how this dramatic increase in household debt might be something to worry about. Maybe. I’m not an economist. But I do think this is designed to boost the Chinese growth machine and I do think it makes them less reliant on other countries — such as, maybe, the United States.

  • The world’s top oil producers

    Using data from MarineTraffic (which is definitely worth a click through), the New York Times has created this terrific animation showing the flow of oil tankers from the Persian Gulf to the rest of the world from May 15 to June 15, 2019.

    Here’s a screenshot:

    About 20% of the world’s supply of oil flows through the Strait of Hormuz, a tiny passage located between Iran (north) and the UAE (south). See above.

    The article also has a number of other charts that speak to changing supply and demand patterns. Note the US, China, and Iran.

    Here are the top oil producers (total petroleum liquids) and the top crude oil exporters in 2018 (both are measured in millions of barrels a day):

    And here are the top oil consumers ranked by 2016 data (total consumption of petroleum and other liquids):

    Images/Charts: New York Times

  • Cumulative electric vehicle sales around the world

    When I was shopping for a new car last year I gave serious thought to buying an electric vehicle. In fact, it is what I initially set out to do. But I couldn’t find a model that I liked and I didn’t feel like the charging infrastructure was in place for me to go on snowboarding trips to places like Quebec or Vermont. So I went with an ICE vehicle. But we all know it is only a matter of time before we hit that tipping point, which is why 100% of the parking spots at our Junction House project will be ready for an electric vehicle charging station.

    According to a recent briefing from the International Council on Clean Transportation (ICCT), there were 3.1 million electric passenger vehicles in use around the world at the end of 2017. Almost all of them (98%) were located in China, Europe, Japan, and the United States, and nearly half of them (44%) were located in just 25 cities. Shanghai leads the world (or at least it did at the end of 2017) with 162,000 cumulative sales since 2011. This represents 5% of all global electric vehicle sales during this time period.

    The footnote to this is that most of Shanghai’s electric vehicles are actually plug-in hybrid electric vehicles, whereas in the case of Beijing — which is second only to Shanghai in terms of cumulative sales — it is virtually all battery electric vehicles. Digging even deeper, if you look at the share of electric vehicles sales in each city, it becomes clear that, on a per capita basis, the real leader is actually Norway. Between 40-50% of all cars sold in Oslo and Bergen were electric in 2017.

    Here is a chart from the ICCT:

    What is clear from these leading cities is that there are supportive policies and incentives in place to accelerate the adoption of electric vehicles. The chicken-and-egg dilemma, which is what I ran into, is that you really need the installed charging capacity. The ICCT estimates that the top 25 electric vehicle markets have about 24x the available charging per capita compared to other cities. That certainly helps.

  • Shenzhen’s solution to jaywalking

    I just finished watching this Bloomberg video on Shenzhen, called “Inside China’s High-Tech Dystopia.” The video obviously has a particular point of view, but there are parts of it that I wasn’t overly fussed about, such as the push toward increased factory automation. Jobs evolve. We used to have elevator operators. Now we don’t. Presumably those people found other empoyment.

    What stood out to me was Shenzhen’s solution to jaywalking. They use cameras, facial recognization software, and a “wall of shame” to fine and then discourage people from illegally crossing a street ever again. One guy in the video explains how he once had the fine automatically withdrawn from his WeChat account. No authorization required. And it happened within seconds following the infraction.

    That feels unsettling. (If you only want to watch the jaywalking part, skip ahead to 5:35 in the video.)

  • Largest airport in the world

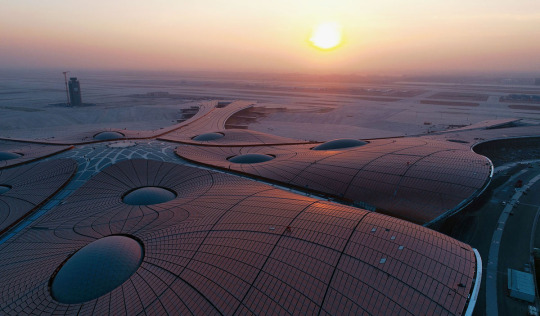
    I just finished scrolling through these photos (from the Atlantic) of Beijing Daxing International Airport, which is currently under construction about 46 kilometers south of Tiananmen Square. The first phase is expected to open in the second half of this year. It will be about 7.5 million square feet and be capable of handling some 72 million passengers per year (100 million at full build out). 

    Supposedly all of this will make it the largest airport in the world, which is pretty impressive considering Beijing Capital International Airport is already one of the busiest in the world. It too moves around 100 million passengers a year and is likely to overtake Hartsfield-Jackson Atlanta in the near term (if it hasn’t already).

    But in addition to being the biggest and baddest, two other things stand out to me about the design of Beijing Daxing. 

    The first is its starfish design. This was done to minimize the amount of walking between security and gate. Check-ins happen in the middle of the starfish and then the most you’ll ever have to walk is 600m (to end of one of the limbs). That’s in line with what most people would consider a reasonable urban transit radius.

    The second is the fact that the check-in area provides an aerial view of the gates below. You can see this layering in the photos from the Atlantic. This was done to create a visual connection between passengers and their family and friends. Usually, the goodbye waves happen at or before security. Here you get a bit more time. (Will security be an issue?)

    For the full set of photos from the Atlantic, click here. I have a thing for airports, so I thought this was a great set.

    Image: Wang Mingzhu via the Atlantic 

  • Tallest buildings completed in 2018

    image

    The Council on Tall Buildings and Urban Habitat (CTBUH) recently published their annual study looking at all of the 200+ meter tall buildings completed over the last year.

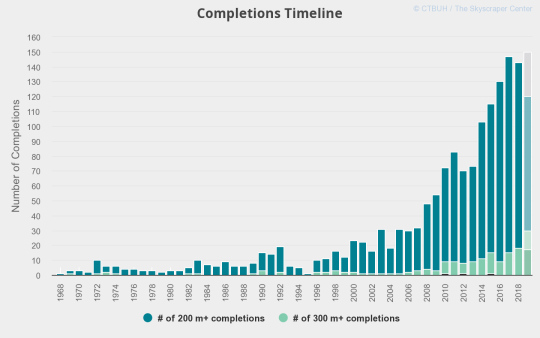
    143 were completed around the world. The all-time record was 147, which was in 2017. Last year, 18 “supertalls” were also completed. A supertall building is generally defined as having a height of 300m or more.

    The tallest building completed in 2018 was China Zun in Beijing. Pictured above. It is 527.7m tall (to tip), but the occupied height is 513.5m. 

    It was designed by Kohn Pedersen Fox Associates and looks like a Chinese finger trap. All iconic buildings deserve an endearing nickname, right?

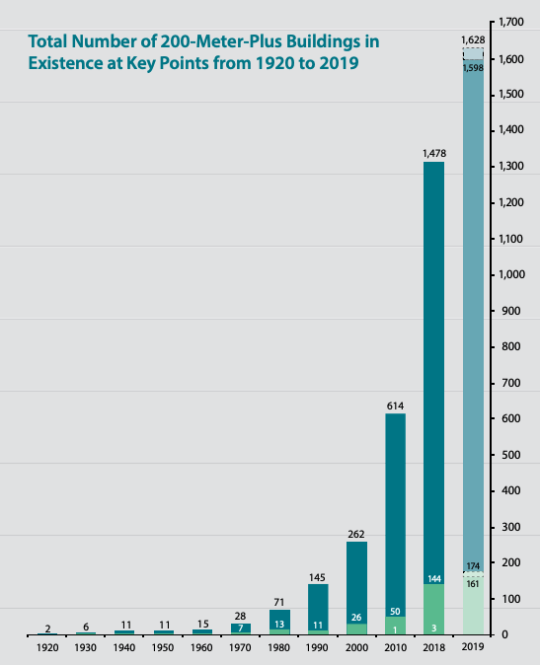
    Below are a few interesting charts from the report. The first is the total number of tall buildings over 200m from 1920 to 2019. At whatever point they chose in the 1920s, there were only 2. Things sure changed starting in the 1980s.

    image

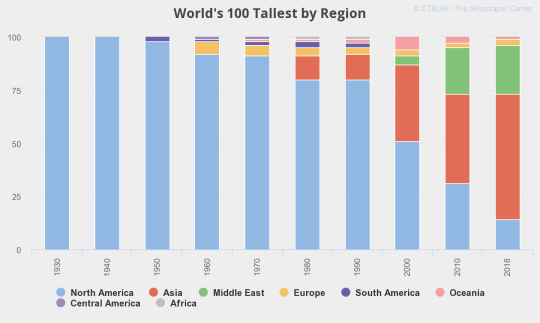
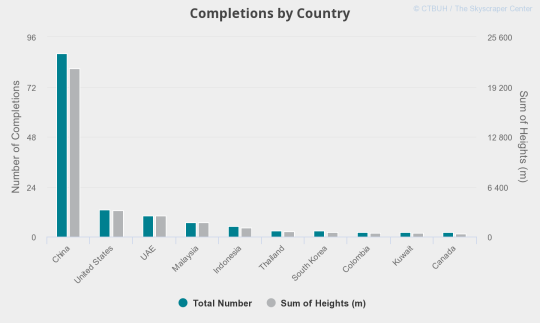
    That exponential growth happens to coincide with tall building growth in Asia and in particular China. The next few charts show (1) the handover from North America to Asia; (2) completions per year (broken down by talls and supertalls); and (3) completions by China, I mean country, last year.

    imageimageimage

    The full 2018 year in review report can be found here.

    Image: CTBUH

  • Housing supply is like food supply

    A few months ago I wrote about an upcoming book by Alain Bertaud
    called, Order
    without Design: How Markets Shape Cities.
    Well the book has just come out
    and CityLab just did an interview with him. 

    Bertaud has worked all around the world from Yemen to China and his experiences, particularly in places that were transitioning to market economies, lend an interesting perspective.

    I like this bit on designing in China:

    I quickly realized that if you do not have prices to guide you, you end up relying on arbitrary norms. For example, in China, the central government decided that every home must have one full hour of sunshine each day. So you would plug in the height, latitude, and angle of the sun at winter solstice for your site, and that would formulaically spit out the permitted density of housing.

    And I like the comparison he makes between food and housing supply:

    I compare it to food: You can’t solve a famine by simply mandating that everyone eat 2,000 calories a day. That’s absurd. You have to bring in more food. In the same way, cities like San Francisco have to increase the supply of floor area, and let consumers determine the size of units.

    So I just ordered a copy of his book

    For the rest of his interview with CityLab, click here.

  • China has a lot of people

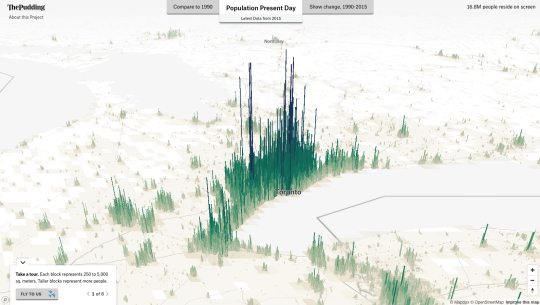
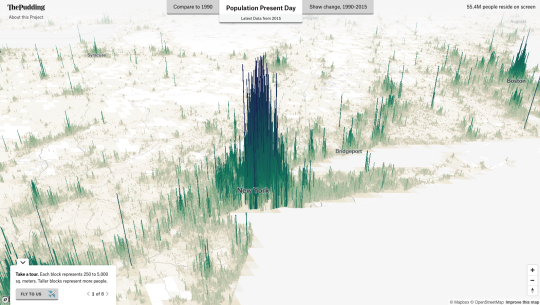
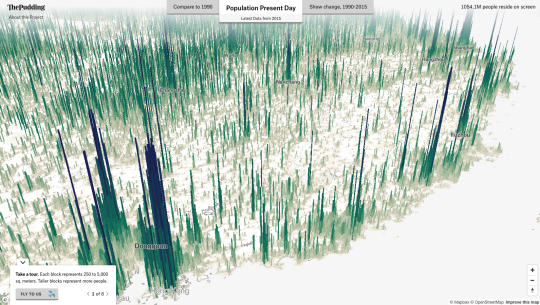
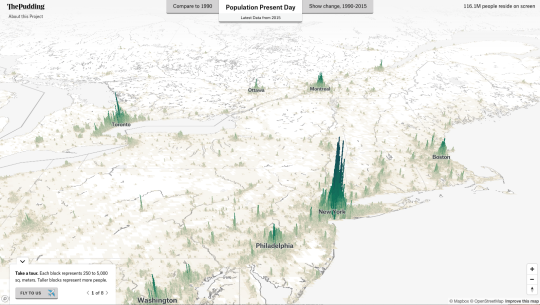
    Matt Daniels over at The Pudding recently visualized the world’s population in this spiky 3D map. You need to take a look. Better on desktop.

    The data is from 2015, but you can also compare it to and show the change from 1990.

    Here is the Greater Toronto and Hamilton region (16.8 million people reside in this screen grab):

    Here is the New York City region (55.4 million people reside in this screen grab):

    And here is China (1.054 billion people reside in this screen grab):

    I tried to capture both Shanghai and Hong Kong in this image. Guangzhou, Hong Kong, and Shenzhen are currently in the mist of forming a 40 million-person megalopolis.

    If we pan back over to the northeastern United States and Central Canada – keeping the same scale as the above image from China – it looks like this:

    These last two images say a lot.