Daily insights for city builders, delivered every morning at 6 AM ET. I’m Brandon Donnelly — a Toronto-based real estate developer and founder of Globizen. I’ve been writing here since 2013.

Tag: central london

  • London’s clean air zone

    In 2019, London implemented something known as an Ultra-Low Emission Zone (or ULEZ). The intent was to reduce the number of older and higher-polluting vehicles entering and driving around the city.

    It works like this: If you have a vehicle that does not meet the ULEZ emission standards, you need to pay a daily charge of £12.50. This applies all day every day (except Christmas) and it is in addition to London’s congestion charge.

    It’s also done entirely through license plate cameras. If you enter the zone, don’t have an approved plate, and don’t pay the charge within a few days, you get sent a fine. The result is that London’s ULEZ is now the largest clean air zone in the world (at least according to London).

    It also achieved its intended purpose. In 2017, only 39% of cars entering London would have met the ULEZ emission standards. Today the number is over 95%. Meaning, most people don’t actually pay the charge.

    At the same time, nitrogen dioxide levels in the zone have more than halved, improving overall health outcomes. It’s a perfect example of taxing the things you want less of. What’s also interesting is that there were positive second-order consequences.

    Vehicle traffic as a whole declined by about 9% in the first year, with no evidence of displacement to other areas. And according to this research study, it actually encouraged more kids to walk and take other forms of “active transport” to and from school.

    Seems like a no brainer to me.

  • The future of central London

    The Centre for London has just published an interesting report called, Core Values: The Future of Central London. Like most city centers, Central London (or the Central Activities Zone as the report calls it) punches well above its geographic weight.

    Central London occupies about 0.01% of the UK’s total landmass, but is responsible for about 10% of its economic output. It represents about 2% of London’s total footprint, but is responsible for about 40% of total employment and about 45% of economic output.

    Here’s another interesting stat:

    From 1961 to 1983, the residential population of CAZ boroughs in London fell from about 2.5 to 1.7 million. And things really didn’t begin to turnaround until the late 1980s. It took until 2018 for the population to return to 2.5 million. Makes me wonder: How concerned do you think people were in the late 1970s about housing affordability in Central London?

    To read the full report, click here.

    Chart: Centre for London

  • Why dynamic road pricing is inevitable

    The Economist recently published an article called: How and why road-pricing will happen. If you’re a regular reader, you’ll know that there’s been lots of talk and support

    over the years

    on this blog for dynamic road pricing.

    It’s politically unpopular, but it’s an incredibly rationale way to deal with traffic congestion. 

    In Singapore – home of the world’s first congestion charge zone (1975) – they constantly monitor traffic congestion. As soon as average speeds drop over a three-month period, they simply raise the charge. Congestion gone.

    We know this works, but for many reasons road pricing is highly divisive. According to The Economist, there are a few reasons why this is going to become a bit more politically palatable.

    For one, the take from gas taxes and vehicle duties has been declining in Britain over the past couple of years. Electric vehicles will only exacerbate this trend. So governments are going to be forced to look elsewhere for money.

    Secondly, traditional tolls and congestion charges are becoming increasingly ineffective. Today in central London, private-hire vehicles are said to make up about 38% of all car traffic – almost double the share of traditional black taxis. 

    These are cars circling around the city, picking up passengers. Blunt charges based on suburbanites entering the city in the morning and leaving in the afternoon is simply not capturing the way that many of us move around our cities today.

    In other words, urban mobility is undergoing dramatic changes and the revenue and congestion management tools are going to need to adapt. If you’re interested in this topic, check out the full article here.

    Photo by chuttersnap on Unsplash

  • Coffee shops vs. fried chicken

    When it comes to a real estate market, there are always the typical metrics: sale prices, rents, vacancy and so on. But I’m always interested when somebody looks at the market in a different way and comes up with other kinds of metrics.

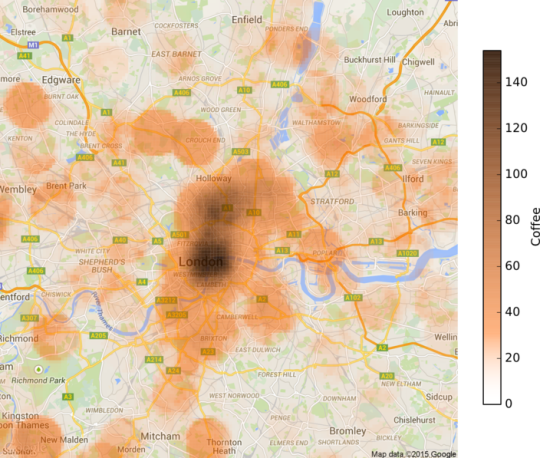
    That’s why I was intrigued when I stumbled upon this post by Sam Floy, where he looks at the concentration of coffee shops and friend chicken shops across London in order to determine which neighborhoods are in fact “up and coming.”

    To give you a taste, here’s his coffee shop map:

    His thinking was that if a neighborhood had a high density of coffee shops, a low density of fried chicken shops, and relatively low house prices, then it could probably be thought of as up and coming. 

    Coffee shops are often considered to be leading indicators of urban change (i.e. gentrification), and, well, friend chicken places I guess speak to a different kind of neighborhood.

    These sorts of playful studies aren’t going to tell you exactly which numbers you should be plugging into your development pro forma. But I think unconventional analyses can sometimes tell you a bit more of the story behind the numbers.